Home » Improvement Stories » Reducing waiting lists in the Newham Community Adult Diabetes service
Reducing waiting lists in the Newham Community Adult Diabetes service
27th August 2024
Written by Michael Asumah (Diabetes Clinical Lead), Michael Marin (Performance Lead) and Clarissa Sørlie (Improvement Advisor)
The Newham Community Adult Diabetes service have launched a Quality Improvement (QI) project to reduce waiting times for their service.
Figure 1. Photo of the Adult Diabetes team: Michael Asumah, Sarah Boatema, Rita Osemwengie, Mary Aji, Abibatu Jalloh-Charley, Patience Agoha, Sudheera Thake, Saraspathy Srirangan
Diabetes is a lifelong condition that can cause serious damage to a person’s eyes, feet, kidneys and nerves, and can sometimes lead to heart attacks and strokes (Diabetes UK, 2024). An estimated 1 in 14 people in Newham have type 2 diabetes, with people from South Asian, African-Caribbean or Black African heritage at greater risk of developing the condition (Newham Council, no date). The diabetes team, based at Shrewsbury Road Health Centre, aim to equip people to manage their condition to stay well and intervene at an early stage if issues arise to reduce complications and reduce preventable hospital admissions.
Currently, the average waiting time for a first contact with the service is 99 days, which is longer than the 6-week target set by commissioners. Several factors have contributed to this extended waiting time, including a backlog that accumulated due to COVID, an increase in referrals, and a high rate of people not attending their appointments.
Determined to improve waiting times and reduce missed appointments, Michael Asumah (diabetes clinical lead) has formed a QI project team to further understand the issue and make improvements.
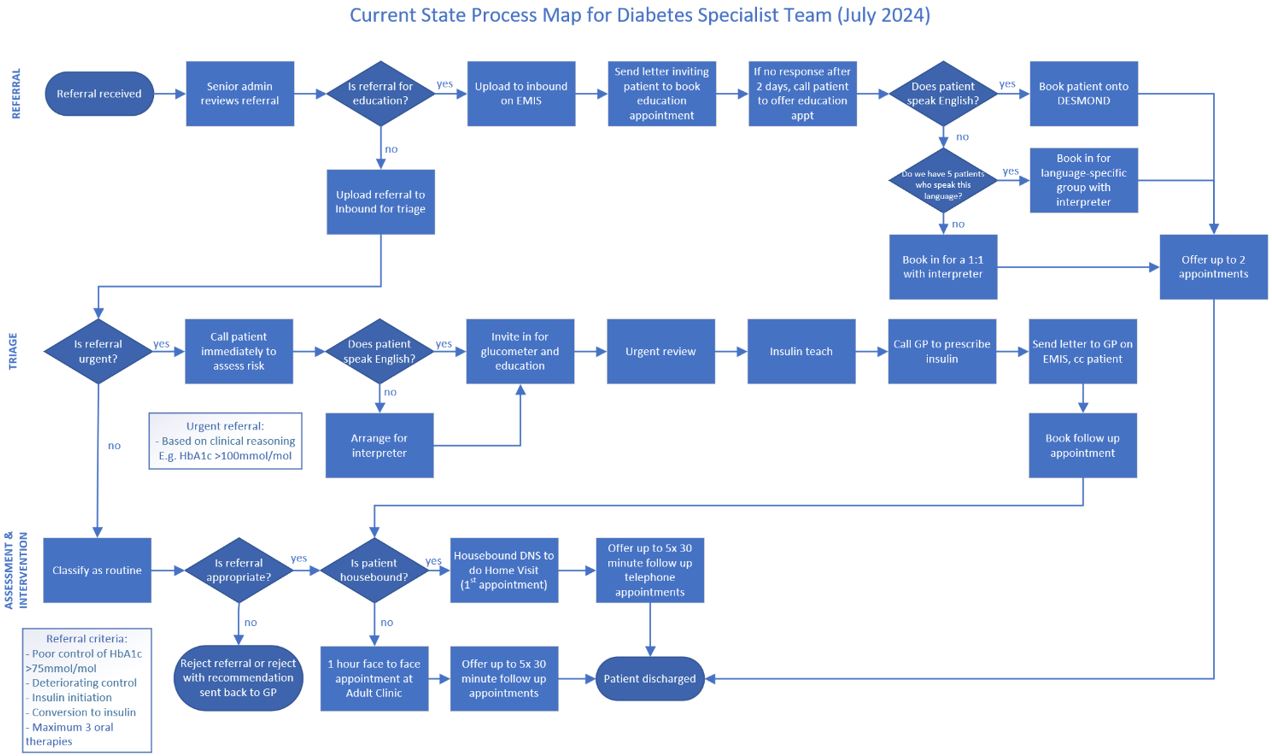
With the help of their QI coach, Michael Marin (performance lead), the team have mapped their processes from referral to discharge and identified opportunities for improvement. To do this, they used a tool called a flow diagram, or process map (see image below).
Figure 2. Flow chart from referral to discharge
To understand the problem in depth, the team will use a cause-and-effect (fishbone) diagram to identify the factors contributing to extended waiting times. As part of this, they will be looking closely at their rates of non-attendance at appointments, currently at an average of 46%. This will prepare them for generating change ideas and developing their theory of change, which they will capture using a driver diagram.