
Using QI tools to help understand barriers to Community Mental Health Teams referring patients to the Perinatal Service in Bedford & Luton
8th April 2026
Project Lead: Dr Irum Siddique
Project Team: Olajide Fasanya, Georgia Betts, Amy Quincey
QI Coach: Beatrice Tinkler. Improvement Advisor: Cassie Philpin
Albert Einstein is quoted as saying, “If I had one hour to solve a problem, I would spend 55 minutes thinking about the problem and 5 minutes thinking about the solution.”
In healthcare however, the desire to act quickly to improve things for patients can mean teams rush into solution-mode. Without pausing to understand a problem fully, we risk focusing on the wrong issue, creating unintended consequences, or putting energy into changes that don’t last. Taking time at the start of a QI project to fully explore the issue isn’t a delay; it’s an investment in getting things right.
So, when the PCMHT noticed a decline in referrals from CMHTs, they resisted the urge to dive straight into fix things and instead, they began investigating.
- ReviewingPowerBI and patient notes
Using the PowerBI trust dashboard, the team reviewed monthly referral numbers, acceptance rates, and referral sources. They found that acceptance rates had increased (Figure 1), indicating rising need. But between January and March 2026, most referrals came from GPs (112) and midwifery services (67), with only 17 from CMHTs (Figure 2).
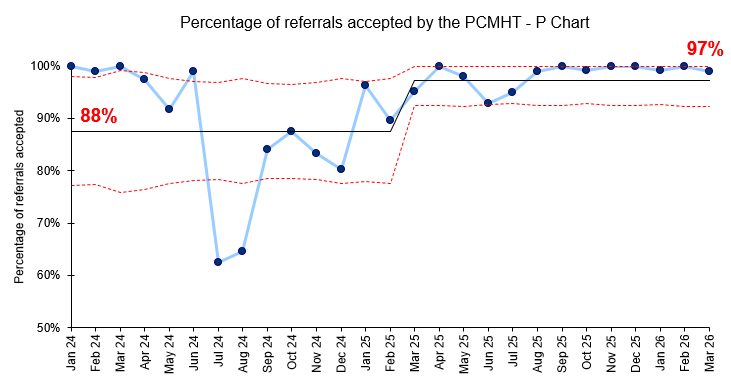
Figure 1: Percentage of referrals accepted by the PCMHT per month (P Chart)
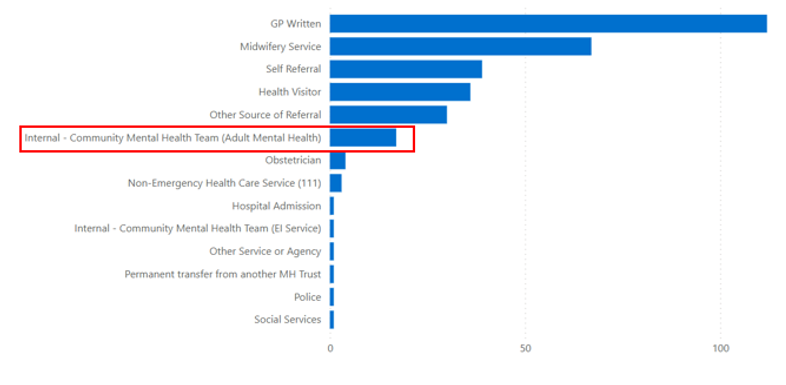
Figure 2: Source of referrals to PCMHT over 3-month period
A review of midwifery referrals over six months showed that 20 of the 150 patients were already open to CMHTs, while 2 had been discharged from their CMHT the same month the midwifery referral was made to the PCMHT. This confirmed a clear opportunity to improve the identification of people under CMHT care who might benefit from early PCMHT involvement.
- Staff Surveys
To understand staff perspectives, the team surveyed CMHT and PCMHT colleagues about their awareness of the service, barriers to referrals, and ideas for improvement.
- Fishbone Diagram
Using the survey findings and their own insights, the team created a fishbone diagram to map the factors contributing to low CMHT referrals (Figure 3).
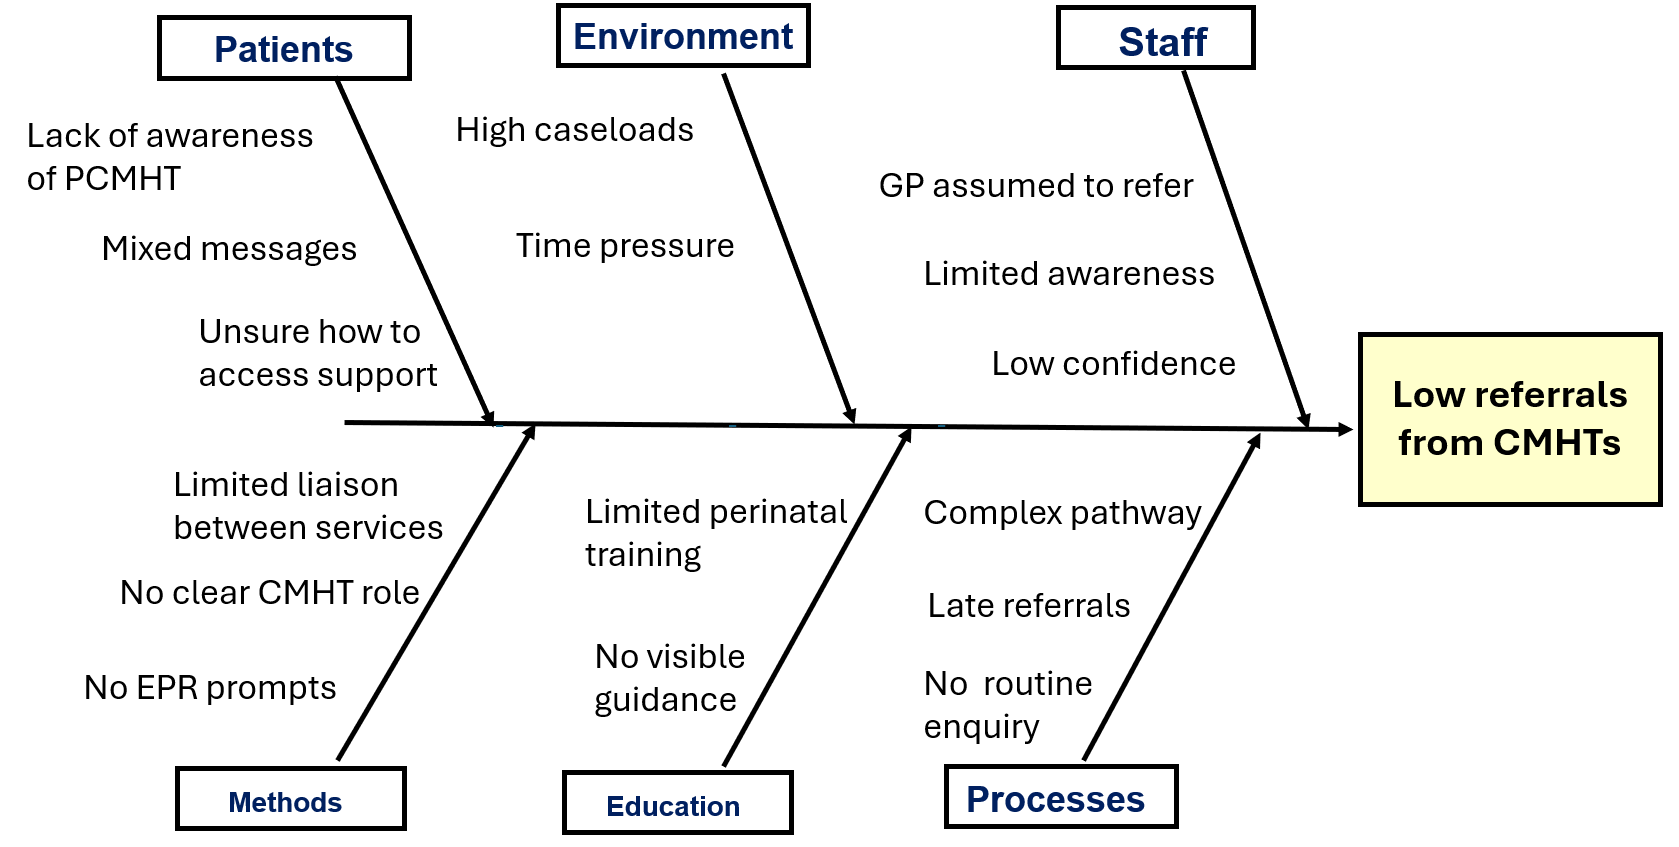
Figure 3: Fishbone diagram
- Pareto Chart
The team then used survey responses to produce a Pareto chart (Figure 4), helping them identify the highest impact areas for improvement. The key contributors to low referrals were:
- Assumptions that other services were responsible for referrals
- Lack of awareness of referral criteria
- Unclear referral pathways
- Fewer pregnant people currently open to CMHTs
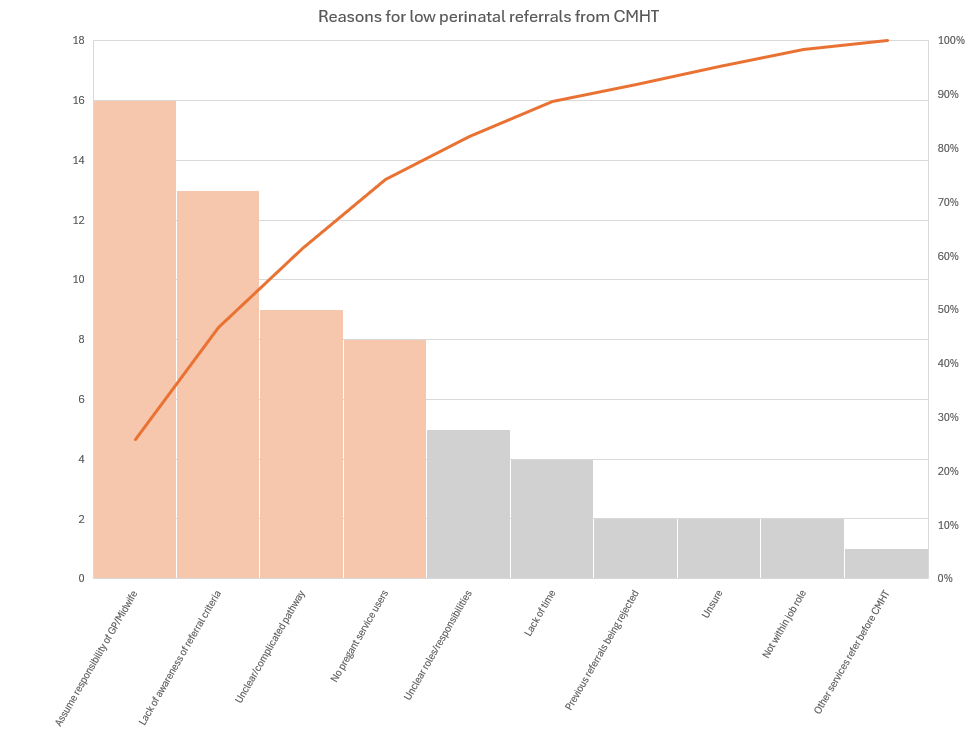
Figure 4: Pareto chart
Building a change strategy
The use of data helped clarify the need to work with CMHTs to improve referral rates, the survey and the fishbone diagram helped to develop a thorough understanding of the causes of the problem, and the pareto chart helped the team to focus in on the areas that they should improve.
This knowledge informed their Driver Diagram (Figure 5) and guided the selection of their first change idea: MDT teaching sessions about the PCMHT service offer and referral criteria. They will use the number of referrals received from CMHTs each month and feedback from clinicians as a way to measure its impact.
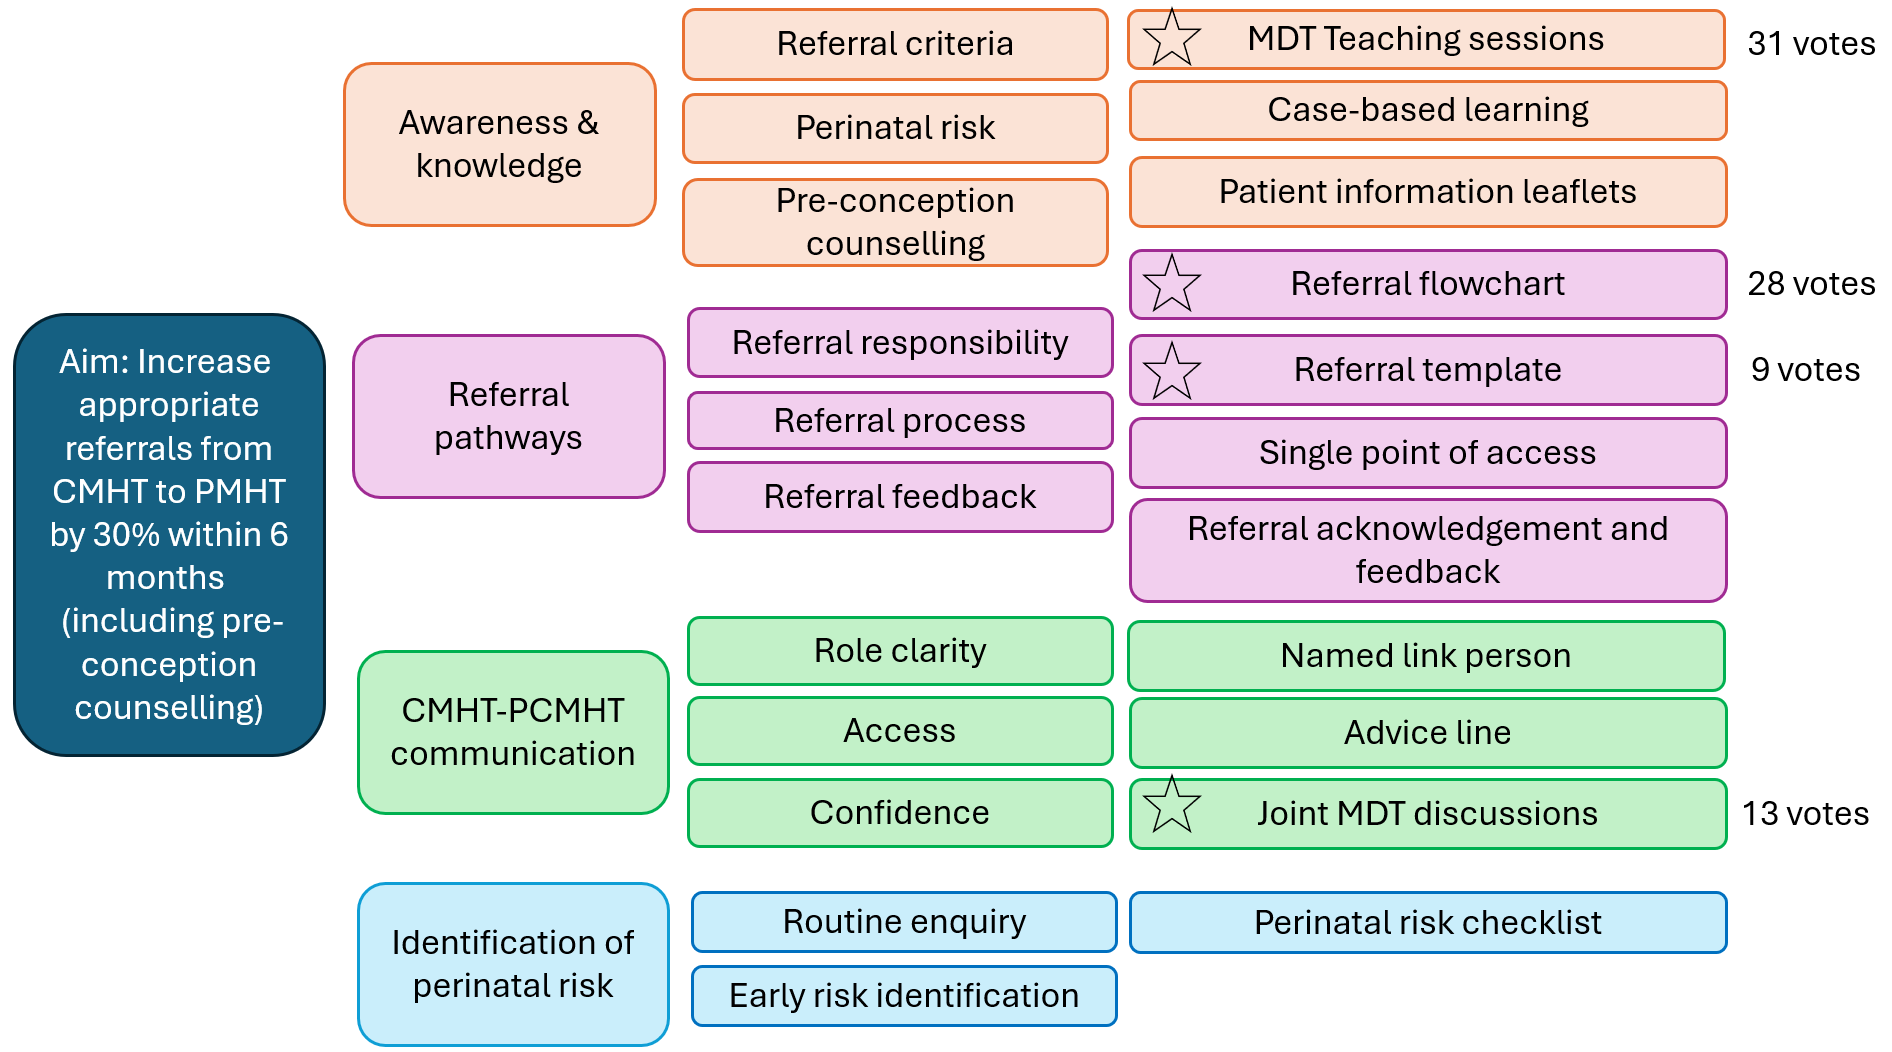
Figure 5: Driver Diagram
Project Lead, Dr Irum Siddique, reflected that ”working on this QI project has reinforced that small, targeted changes can lead to meaningful impact, aligning with the principle that continuous improvement is better than delayed perfection.”
Most Read Stories
-
Why is Quality Control important?
18th July 2018
-
2016 QI Conference Poster Presentations
22nd March 2016
-
Recognising Racism: Using QI to Help Take Action
21st January 2021
-
QI Essentials: What does a Chief Quality Officer do?
18th March 2019

-
Using data enabled us to understand our problem
31st March 2023
-
Follow QI on social media
To keep up to date on the latest concerning QI at ELFT, follow us on our socials.