
City & Hackney’s observations data collection tool
24th May 2023
By Rebecca Lingard (Borough Lead Nurse City and Hackney), Tim Stevens (Quality and Performance Manager) and Linnea Miklaucich (Improvement Advisor)
City and Hackney Centre for Mental Health developed a tool to capture the percentage of inpatient observations completed. In this 3-minute read they share how the tool was created, tested, and easily incorporated into business as usual for their ward admins. As a result, they are now capturing daily observation data from all seven wards.
Using routinely collected data to improve our percentage of completed inpatient observations
Consistent completion of observations has been a longstanding issue in mental health settings. Observations can often be missed due to competing priorities, incidents, or simply being forgotten and patients’ experience of being observed is poor. To address this, a Trust wide programme of work began in the autumn of 2022.
A key element of all improvement work is to collect data that tells us if we’re improving or not. We knew we needed to improve the percentage of completed observations each day and we were already collecting that data on paper, but how could we make it easily accessible to use in our QI project?
Using the Plan Do Study Act (PDSA) cycle to develop and test a new data collection tool
We developed a data collection Excel spreadsheet, with one tab for each ward to record daily observations completed (see Figure 1).

Figure 1 – example ward tab, one for each of the seven wards
As well as a tab for pulling the data for all seven wards into one (see Figure 2).

Figure 2 – Tab pulling data from all wards
To make the recording as simple as possible we also added a “Daily Admin Tool” tab that makes it straight forward to record expected and actual numbers of observation records per patient for that day (see Figure 3). The admin reviews the observation paperwork from the previous 24 hours and completes number of expected observations per service user. They then count any gaps in recording. Lastly the admin copies the bottom “Total” row onto the ward’s observations tab (figure 1) for that day.

Figure 3 – Daily admin tool.
As the tool was completely new, we didn’t know how well it would work, how long it would take to fill out, or how staff would feel about using it. We decided to run a PDSA (plan-do-study-act)cycle to test using the tool and luckily our brilliant ward admins agreed to test using it. We made sure to go to all wards to demonstrate the use of the tool and make sure the ask was clear. To our surprise, our admin colleagues reported that the tool was easy to use, didn’t take them longer than 5-10 min each morning and that they felt happy to continue using it.
This was in early January; we have been collecting daily observations data for each ward every day since. Across the unit our expected number of observation records span between three and five thousand per day. See figure 4 our P’ chart of percentage of observations completed, all wards combined. Our next step with this data is getting all ward managers involved with uploading and analysing their ward’s data on Life QI.

Adapting the tool to your own setting
For anyone looking at capturing the daily percentage of observations, our tool would be very easily adapted. You would need to change the names for your wards, make sure the dates are right – and then you’d be set to go!
If you want to use the tool with your teams, make sure those responsible for capturing the data have been shown how to use the tool. We found that testing the tool first helped to get staff onboard and continuously asking for their feedback makes sure they are involved in the process and can be adapted to meet their needs.
We are very proud of our tool, but even more proud of how staff from all wards have come together to work on this very important issue. And a huge shout out to our amazing admin staff who collect the data – none of this would be possible without them!
Most Read Stories
-
Why is Quality Control important?
18th July 2018
-
An Illustrated Guide to Quality Improvement
20th May 2019
-
2016 QI Conference Poster Presentations
22nd March 2016
-
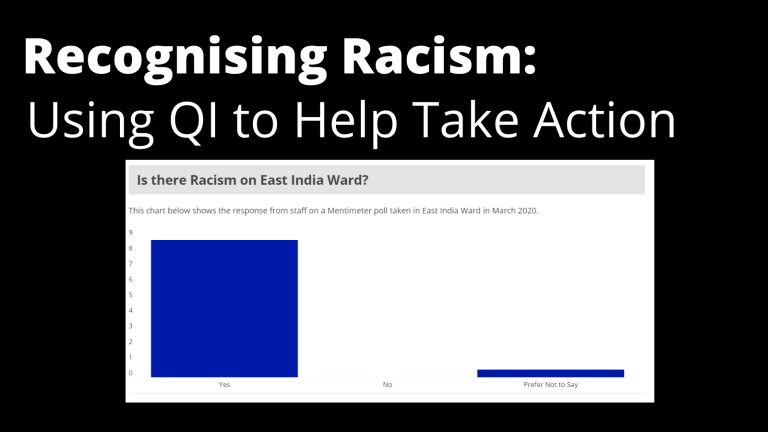
Recognising Racism: Using QI to Help Take Action
21st January 2021
-
Using data enabled us to understand our problem
31st March 2023

-
QI Essentials: What does a Chief Quality Officer do?
18th March 2019

Follow QI on social media
To keep up to date on the latest concerning QI at ELFT, follow us on our socials.