Creating a Driver Diagram with people working remotely
10th June 2020
By Auz Chitewe, Associate Director.
In this article, we share one way that a group of people, all connecting virtually from different locations, went about  creating a Driver Diagram.
A Driver Diagram is a core improvement tool that is useful for visually showing the theory of change for an improvement effort. It helps teams articulate a shared understanding of the things they think they need to do to achieve an aim, their theory, and communicate that to other people. It is essentially a visual representation of their strategy on one page.
The typical approach to creating a Driver Diagram is to do it in person with people who are closest to the system you are trying to change. This starts with agreeing an aim to describe in a timebound way what outcome you want to see, where and by when. This is followed by constructing a list of the main factors/themes that will impact on achieving the aim – primary drivers. Next you would identify sub-themes or components to the primary drivers which will make up the secondary drivers. Finally, you would link change ideas to the secondary drivers.
Background
As part of the Trust’s response to COVID-19 it developed a recovery workstream designed to think about things the Trust would need to do to help people who use, deliver and interact with ELFT services learn from the changes that had taken place due to the pandemic, that could influence the future direction. Due to the restrictions in place as a result of COVID-19, they had to connect using video conferencing which presented the challenge of how to develop a driver diagram virtually
How the Driver Diagram was created
 Co-production: Having diverse views related to the work collectively design the theory of change.
- The group had representation from clinical staff, corporate staff, service users and the trust board.
- We decided to use Microsoft Teams as the virtual meeting platform because it is secure, allows people outside the organization to easily join the meeting and has collaboration features that allow people to contribute and interact seamlessly.
 Divergent Thinking: Using techniques that allow for many ideas to be generated and different perspectives to be heard.
- We would normally use Nominal Group Technique to gather many ideas in a way that does not limit creativity.
- We adapted this concept by creating a simple online survey on Microsoft Forms with the question “What are the top 5 things you think are important for helping us achieve the ambition? (Not specific change ideas)”. People filled this in live during the session after an initial discussion about our aim.
 Affinity Diagram: Grouping the many ideas into a few key themes.
- We used an adapted version of creating an Affinity Diagram to group similar ideas. The facilitator would read out each idea, someone would propose a title for the theme it belonged to and the idea was dragged under that theme.
- When we arrived at a duplicate we made a decision to skip the idea because it had already been discussed.
- We did this for all the ideas to arrive at overarching themes. These became our primary drivers.
- Where ideas were similar but could be broken down into logical sub-themes, these became secondary drivers.
 Equalizing Power: Using methods that allow the broad range of stakeholders to have equal power and influence at every stage of the process.
- Using Microsoft Forms allowed everyone to contribute their ideas and the responses were anonymous.
- We displayed the results from the survey using screen sharing so everyone could see them on their screen.
- The Nominal Group Technique and Affinity Diagram activities were designed to reduce the impact of pre-existing power and influence.
- The facilitator also made sure to draw in different voices along the process.
 Convergent Thinking: Purposefully applying criteria to screen, select, evaluate, and refine the options to ones that have a high probability of helping achieve the aim.
- The traditional methods we would use for convergent thinking were not possible or as engaging because we were working virtually, our purpose was to build consensus and the platform we were using had its limitations.
- We used an adapted version of the Purpose-to-Practice to facilitate the discussion around drivers that we had a high degree of belief would help achieve our aim.
Output
During the meeting, the Microsoft Excel document that had been autopopulated from the initial survey was being amended in realtime in full view of all involved at each step of the process. This produced an aim, some primary drivers and secondary drivers. After the meeting, all this was quickly transferred into the driver diagram below.

Most Read Stories
-
Why is Quality Control important?
18th July 2018
-
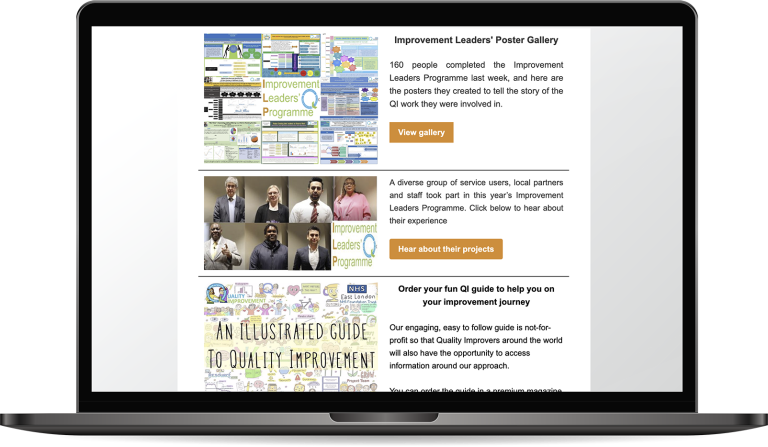
An Illustrated Guide to Quality Improvement
20th May 2019
-
2016 QI Conference Poster Presentations
22nd March 2016
-
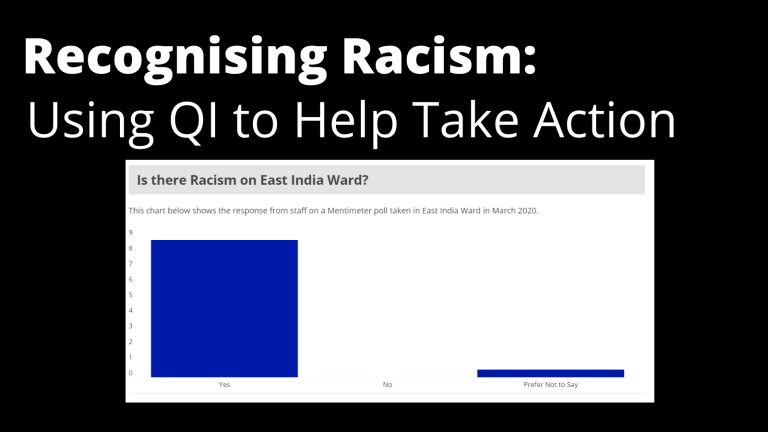
Recognising Racism: Using QI to Help Take Action
21st January 2021
-
Using data enabled us to understand our problem
31st March 2023
-
QI Essentials: What does a Chief Quality Officer do?
18th March 2019
Follow QI on social media
To keep up to date on the latest concerning QI at ELFT, follow us on our socials.