
Exciting changes coming to Life QI
15th June 2020
A major Life QI update is on the way towards the end of June 2020. The update brings with it new features as well as revamps to existing ones. Three things that immediately caught our eye are the changes to the driver diagram, optimised SPC charting functionality and a whole new whiteboard feature.
Driver Diagram
Driver diagrams are also being revamped. They will be more responsive and easier to use. The labelling system has also changed and will be more customisable, with more colours and flexibility of moving connected drivers and change ideas in one sequence.

SPC Charting
The changes will make charts easier to create, add data to and configure. Key changes include:
- Data tables like Excel: data entry will now be done on a familiar Excel sheet interface. This will allow better pasting of data and copying in and out of the sheet is now possible. This will make entering large amounts of data onto Life QI simpler.
- Switching chart types: there will be an option to switch between chart types. This will mean that you will no longer have to recreate a chart/measure due to mistakenly choosing the wrong chart.
- Goal lines: you’ll now be able to add multiple goals and visualise the direction of improvement on the chart and see the progress being made towards realising that goal.
- Exporting: you’ll now be able to define the size of your export image (A1, A2, A3, A4 or A5) and orientation (landscape or portrait) in order to make the best use of the space wherever you need (e.g. PowerPoint, Word etc.).
- Additional charts: you’ll now have a series of other charts available to use such as Pareto or line charts.
Whiteboards
The new whiteboard feature is one of the changes that we are most excited about. Whiteboards will allow you to explore all the improvement tools on Life QI (charts, driver diagrams, PDSAs etc.) in everyday work, outside of Life QI projects.
There are so many potential situations in daily work where an improvement tool can be helpful. The Whiteboard feature will now allow us to create driver diagrams, charts, Pareto diagrams, flow charts and use many other tools, even outside of QI projects.
We’re definitely excited about all of the new feature and updates that will be coming to the platform shortly. You can get a sneak-peak of all the new features here>>>
Most Read Stories
-
Why is Quality Control important?
18th July 2018
-
An Illustrated Guide to Quality Improvement
20th May 2019
-
2016 QI Conference Poster Presentations
22nd March 2016
-
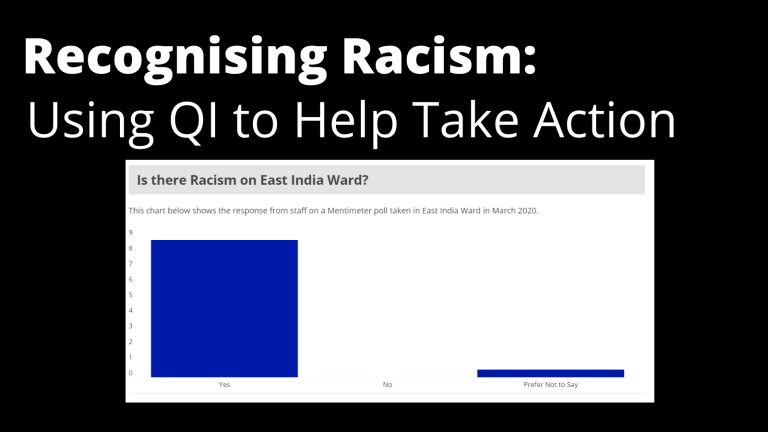
Recognising Racism: Using QI to Help Take Action
21st January 2021
-
Using data enabled us to understand our problem
31st March 2023

-
QI Essentials: What does a Chief Quality Officer do?
18th March 2019
Follow QI on social media
To keep up to date on the latest concerning QI at ELFT, follow us on our socials.