
How easy is it to collect data during improvement work?
5th June 2017
Some of the most common questions that arise when a team is doing improvement work are around data and measurement. This varies from what data to collect, where to get it, how to analyse and present it and how to use it. Some projects can rely on centrally collected data through the various Electronic Patients Records (EPR) systems we use in the organisation.
In most cases, if it’s data you input into the system, you are likely able to pull it out:
- For some data you can run a report in the EPR system and get the data you need.
- For some data, there are tables and dashboards that have been created in Reporting Services based on measures of interest to the service or the clinical directorate.
- In other cases there are more than seventy thousand charts on the Trust’s Quality and Performance Dashboards that teams can use as part of their measurement plan.
At some point in every QI project, teams will have to collect data locally. This may be the same data available from the above platforms, because they may need a sub-set during small-scale testing and for a host of other reasons. On the other hand, there might be some measures that teams are just not collecting data on locally and they need to start collecting. This can be daunting because of the potential complexity of designing the measure and the burden of collecting the data.
The phlebotomy clinics in Community Health Newham faced the later problem in their improvement project aimed at better understanding the experience of people using their service. There are four phlebotomy clinics based in Newham at; Appleby Health Centre, Shrewsbury Road Health Centre and The Centre Manor Park. These services see hundreds of patients on a daily basis, so, receiving feedback from as many of them as possible can help improve the service.
The QI Project team is made up of service leads from different types of staff working in the teams trying to improve the collection of patient reported measures, some senior leaders from the directorate include; commissioners, service users, carers and the governance lead.
The diversity of the project team has helped them explore innovative ways of achieving their aim. They recently started a small scale test of collecting patient feedback using buckets. On a daily basis they would have a patient experience question written on a board and three buckets placed underneath the board for denoting happy, neutral or sad responses to the question. Service users attending the phlebotomy clinic are encouraged to place their clinic queue ticket in the bucket that represents their response as they leave their appointment.
 With this one change idea, one of the phlebotomy clinics has gone from receiving 2 patient experience responses in a month to 1,994 responses in a week. From this, they learnt that 93% of service users were happy, 6% were neutral and 1% were unhappy about the service. This demonstrates how easy it can be to collect data for improvement work. The team are also looking to collect qualitative feedback about people’s experiences of using the service in addition to the quantitative data.
Here is a challenge for you: Could you work with your project team to come up with a simple and quick method for collecting patient experience feedback to give you insights into areas to focus your improvement efforts?
Most Read Stories
-
Why is Quality Control important?
18th July 2018
-
2016 QI Conference Poster Presentations
22nd March 2016
-
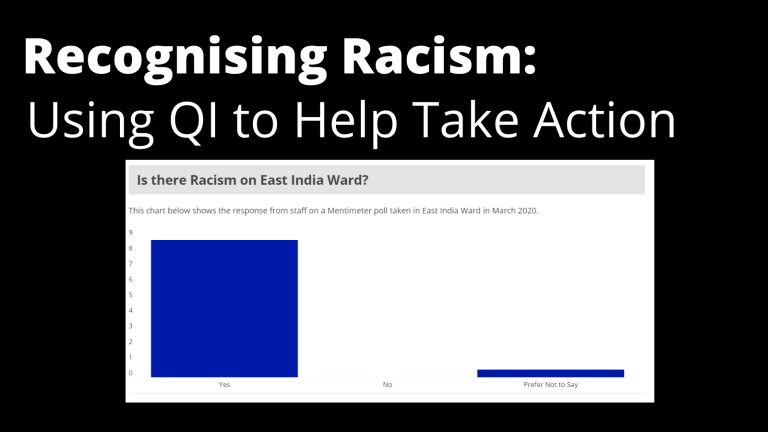
Recognising Racism: Using QI to Help Take Action
21st January 2021
-
QI Essentials: What does a Chief Quality Officer do?
18th March 2019
-
Using data enabled us to understand our problem
31st March 2023
-
Follow QI on social media
To keep up to date on the latest concerning QI at ELFT, follow us on our socials.