
Improving flow in Early Years Speech and Language Therapy
20th September 2021
Using Quality Improvement tools to get to testing change ideas.
By Catherine Heaney, Improvement Advisor
5-minute read
The Early Years Speech and Language Therapy Quality Improvement (QI) project began in April 2021. A multidisciplinary team was formed, representing a range a people from across the departmental and organisational boundaries in Specialist Children’s and Young People’s Services (SCYPS) and the London Borough of Newham. This includes Speech and Language Therapists, managers, administrators, partners from local nurseries and children’s centres and a parent whose little boy attended the service.
The aim for this project is to reduce referral to treatment time in Early Years Speech and Language Therapy from 261 to 126 days by 31/03/2022. The charts below show how the project team were able to make their goal both specific and measurable, by understanding the historical (Figure 1) and baseline data (Figure 2) about referral to treatment times.

Figure 1. Historical data about referral to treatment times, pre-pandemic and during, 2019-2021

Figure 2. Baseline data about referral to treatment times in 2021
The goal is about balancing demand and capacity and optimising flow, so the team began working together to understand the problem using a flowchart (also known as a process map).
The project team meet fortnightly on MS Teams, so a method to process map in a virtual environment was needed. The QI coach gave them an introduction to flowcharts and supported them to agree simple rules for how they would work together (captured in Google Jamboard).
The team created a high-level block diagram together using Google drawings, to understand the main steps in the process from referring a child to Early Years Speech and Language Therapy through to the child starting treatment (see Figure 3).

Figure 3. High level block diagram
Next, they divided into two groups to explore in greater depth. To assist them, the QI coach created a template in Google drawings which included all the basic shapes used in flowcharts (see Figure 4).

Figure 4. Template for detailed flowchart
Using Miro the QI coach combined the flowcharts and through shared exploration, the project team focused on understanding what happened in the existing processes and identifying the quality issues and their change ideas. The team found the session helpful, and you can see some of their feedback in Figure 5 below.

Figure 5. Evaluation of flowcharts in the project team meeting
From this, the team were able develop a theory of change and create a driver diagram (see Figure 6)

Figure 6. Driver diagram
The team have identified that the primary driver of capacity and the secondary driver of maximising utilisation is where they will focus first. The first Plan Do Study Act cycle will be around sending text message reminders to service users.
For others supporting teams meeting virtually on this topic, my top tips using collaboration to create flowcharts virtually are:
- Give a brief explanation of flowcharts as a tool in QI, before you get started
- Choose a virtual platform that everyone finds accessible (in this case Zoom over MS Teams!)
- Choose a method that enabled everyone in the team to participate in creating the flowchart e.g. Google drawings or jamboard
- Spend time in shared exploration of the current processes documented by the flowchart, using this to gain a deeper understanding of the problem and to generate change ideas to help you achieve the improvement goal
Most Read Stories
-
Why is Quality Control important?
18th July 2018
-
2016 QI Conference Poster Presentations
22nd March 2016
-
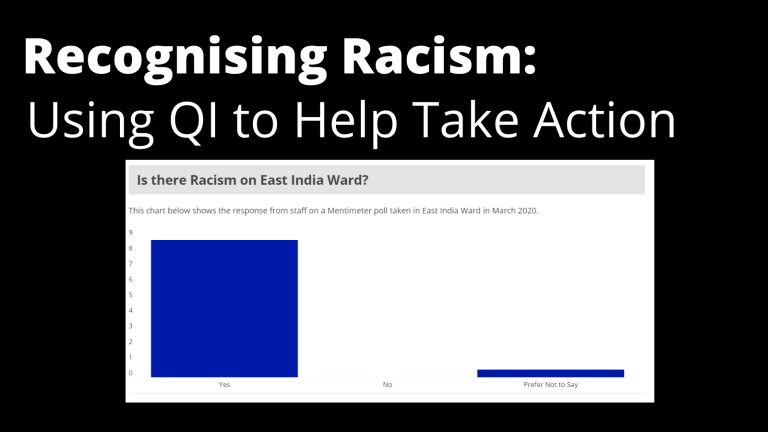
Recognising Racism: Using QI to Help Take Action
21st January 2021
-
QI Essentials: What does a Chief Quality Officer do?
18th March 2019
-
Using data enabled us to understand our problem
31st March 2023

-
Follow QI on social media
To keep up to date on the latest concerning QI at ELFT, follow us on our socials.