Using the Analytics area of Life QI
The Analytics area of the Life QI platform provides statistics on all the projects taking place within the Trust. Below are some instruction on how to locate and interact with the dashboards.
Locating the dashboards in Analytics area
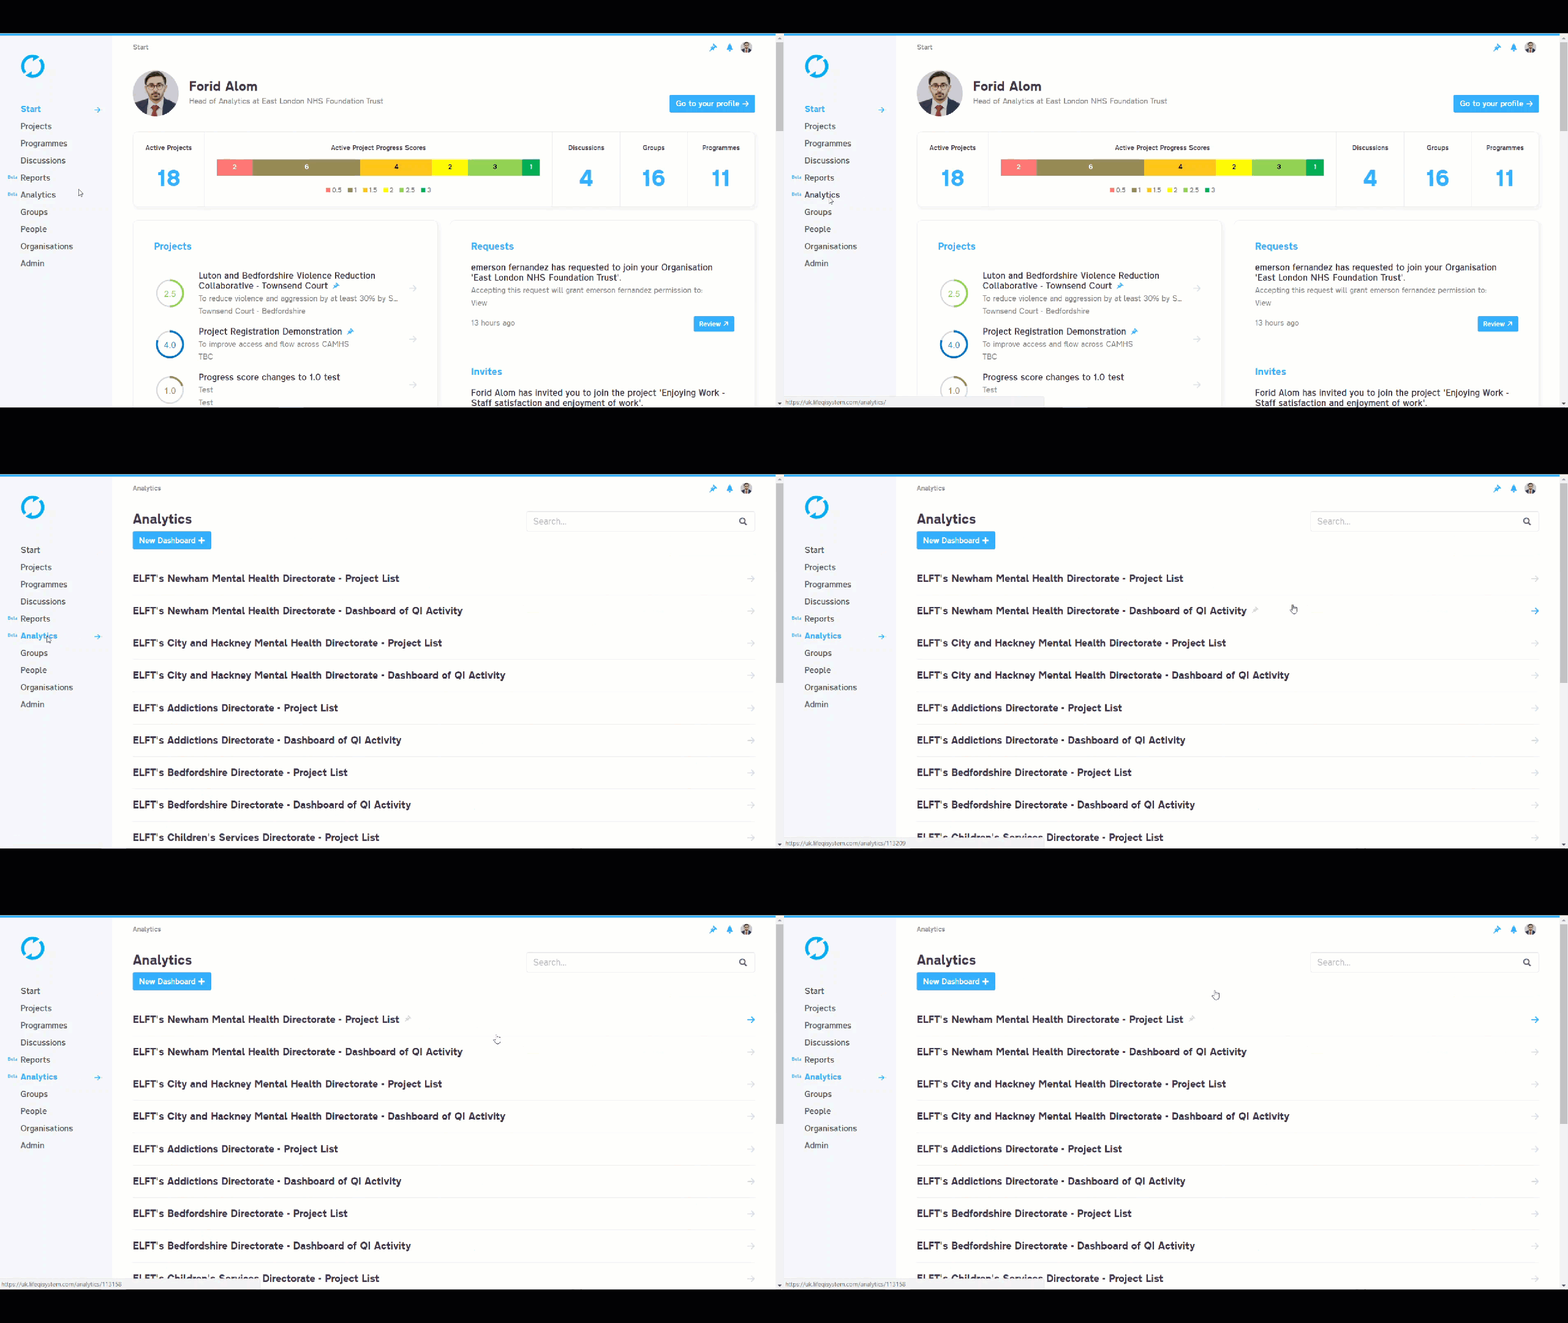
- Log into the Life QI platform
- Click on the “Analytics” area on the left ribbon
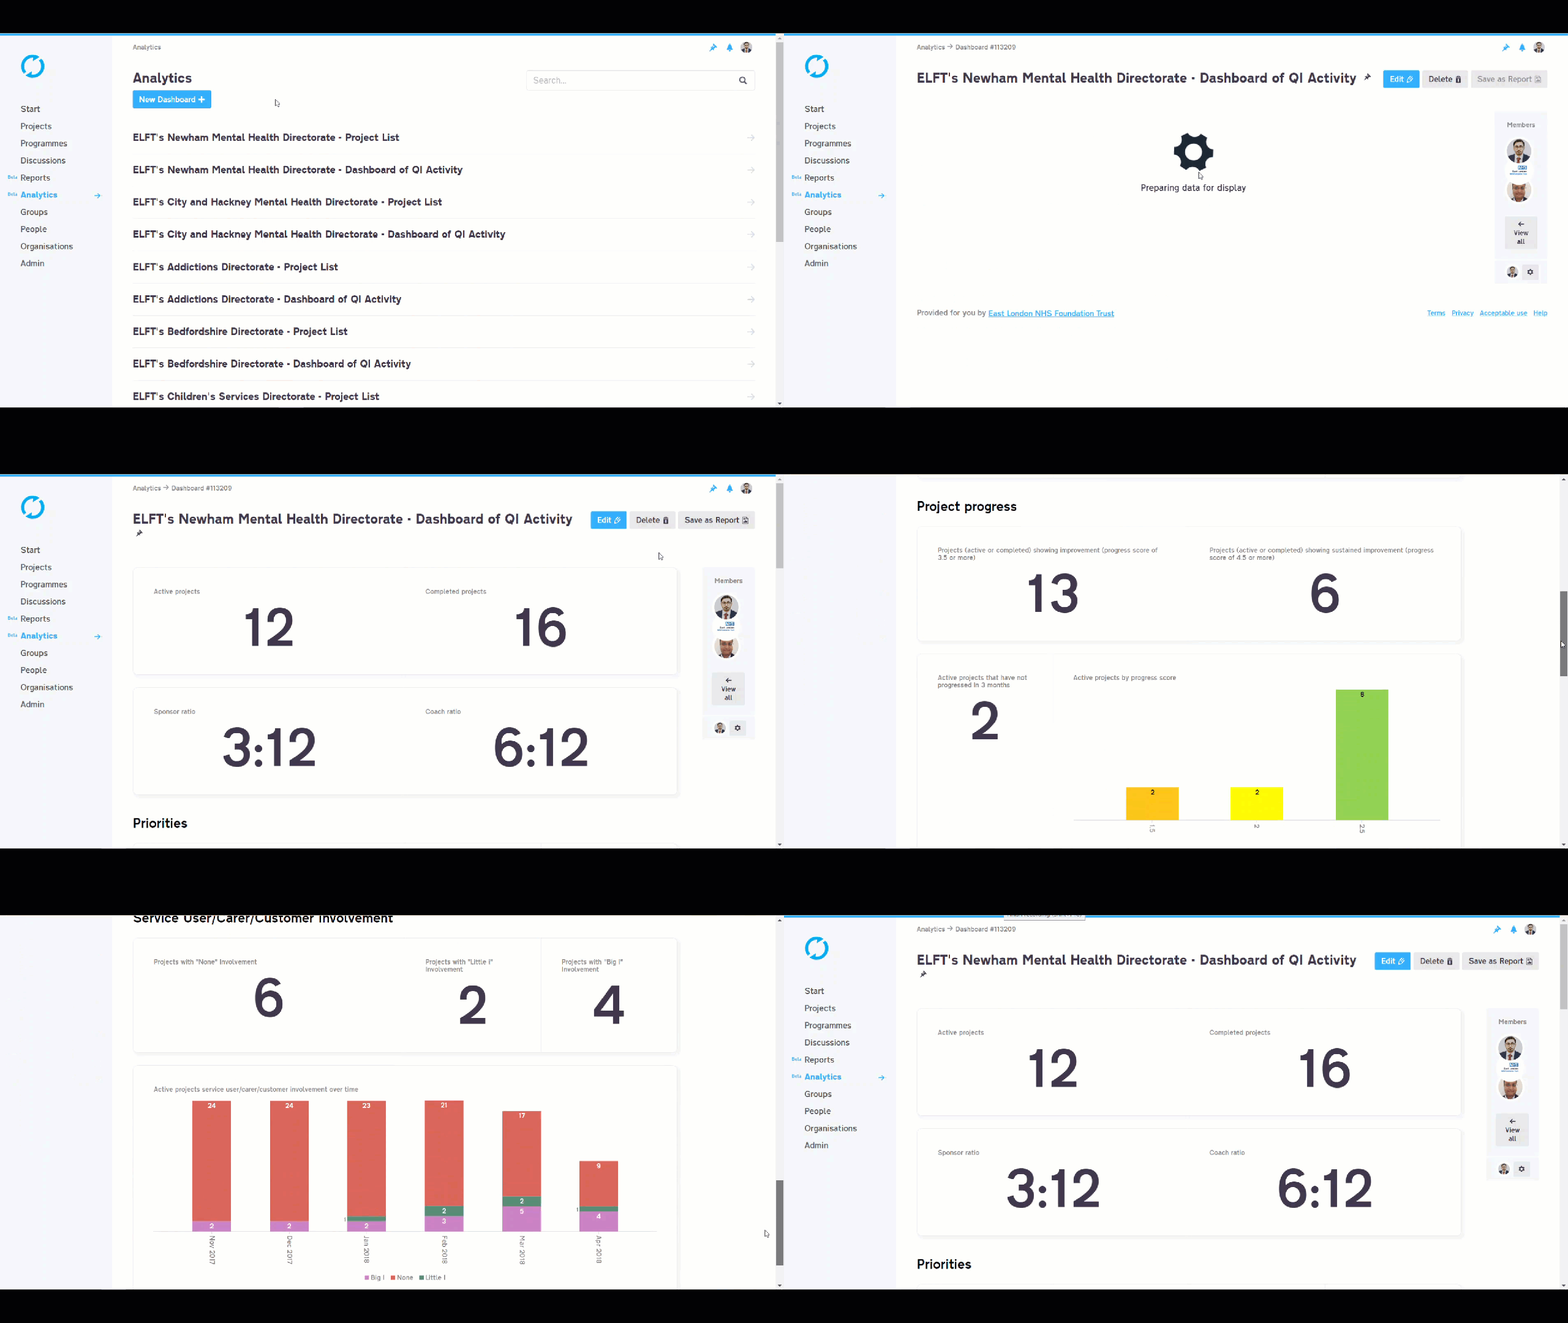
- Every ELFT directorate has two dashboards. A “Project List” and a “Dashboard of QI activity”
Pinning a dashboard to your pinboard for quick access
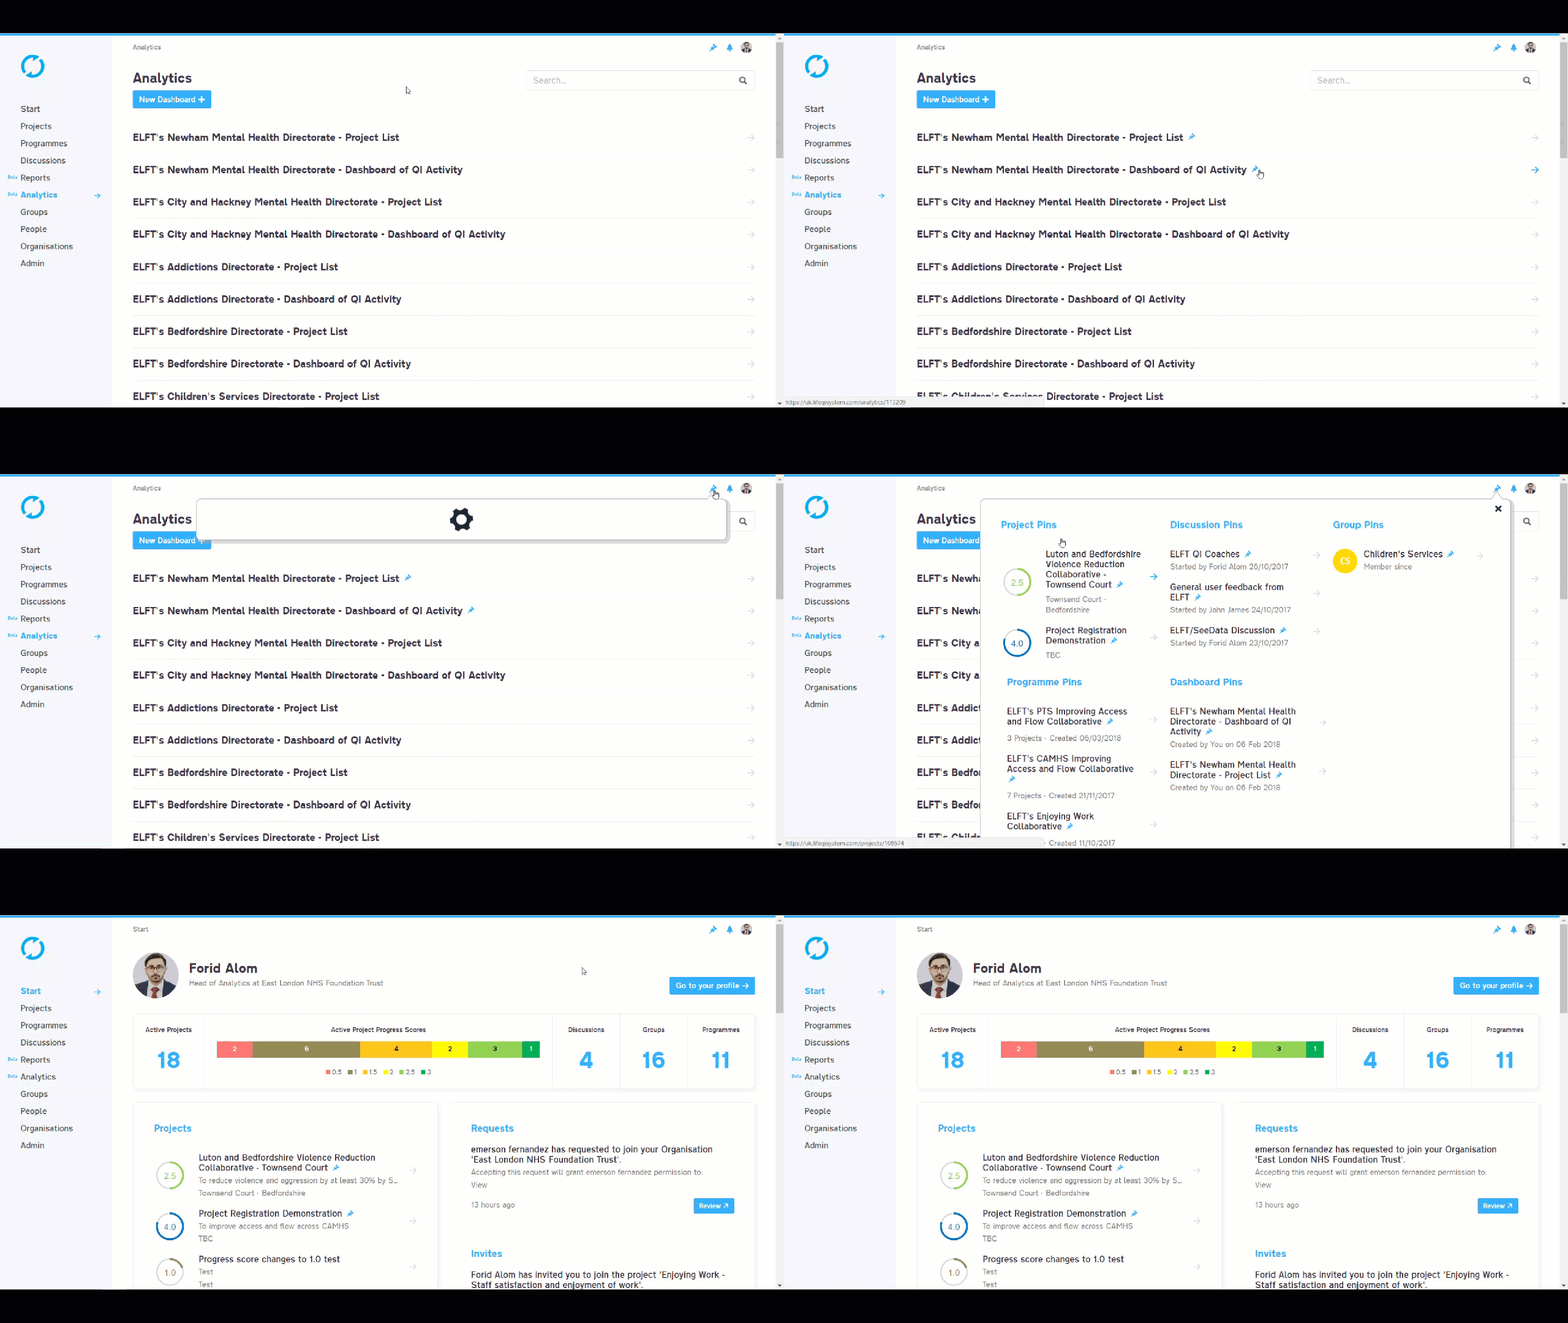
- Click on the pin icon next to the dashboard
- Click on the pin icon on the top right of the platform which is available on any page on Life QI
- Your pinned dashboards will be available for quick access
Using the “Project List” dashboard
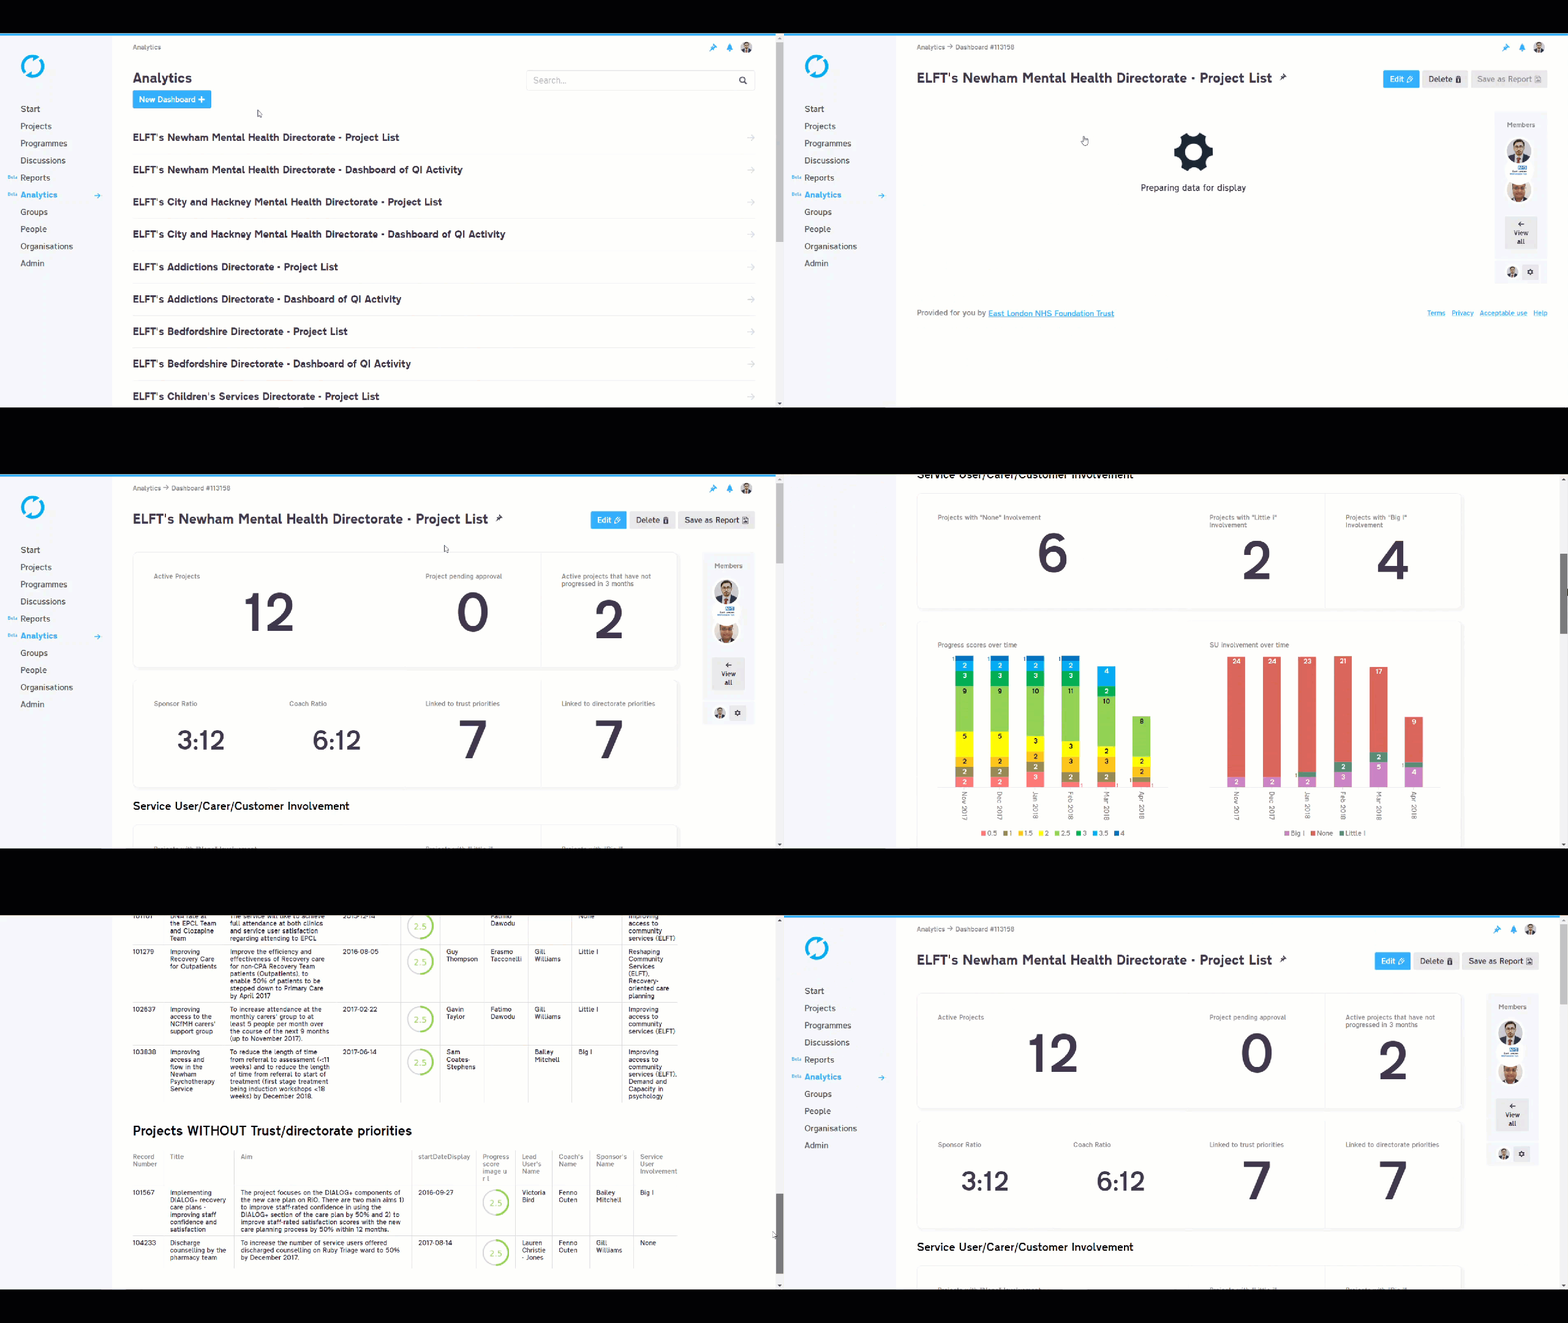
- Click on the “Project list” dashboard you’re interested in
- The dashboard is split into three sections
- The first section provides high level statistics on the QI projects taking place within the directorate
- The second section provides a table of information for all the QI projects that are linked to a Trust or directorate priority
- The third section provides a table of information for all the QI projects that are not linked to a Trust or directorate priority
Using the “Dashboard of QI Activity” dashboard
- Click on the “Dashboard of QI activity” dashboard you’re interested in
- The dashboard will provide statistics on all the active and completed projects taking place within the directorate.
Drilling down to project level information from the dashboard
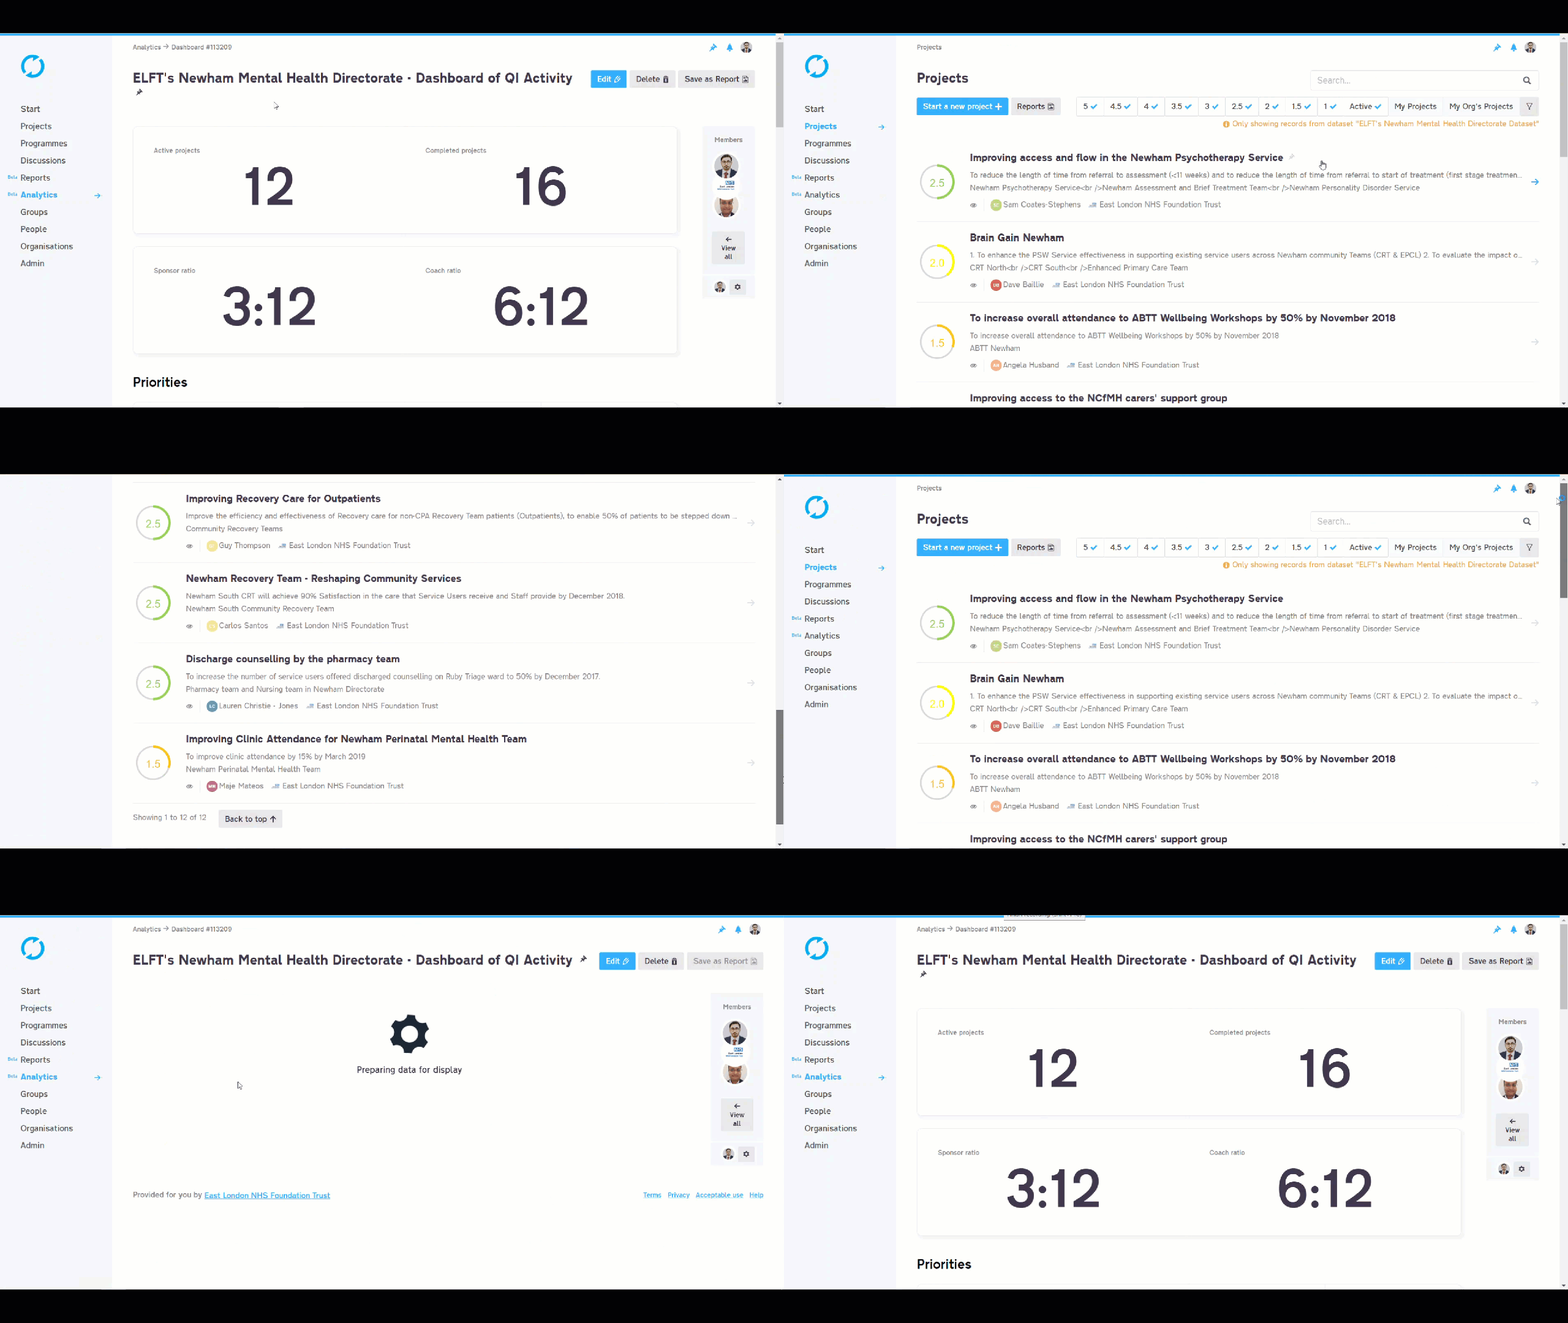
- To see the projects that make up a specific statistic value, click on the chart
- This will provide you with a list of all the projects that relate to that piece of information
- For example, if you click on the “Number of Active QI Projects” statistic, you will get a list of all the projects that are taking place in that directorate
Follow QI on social media
To keep up to date on the latest concerning QI at ELFT, follow us on our socials.

