Bridging Health Inequalities in the Learning Disability Population: A QI Project on Weight Management
14th January 2025
Written by Irem Deniz (Specialist Dietician) with contributions from Vernanda Julien (Improvement Advisor)
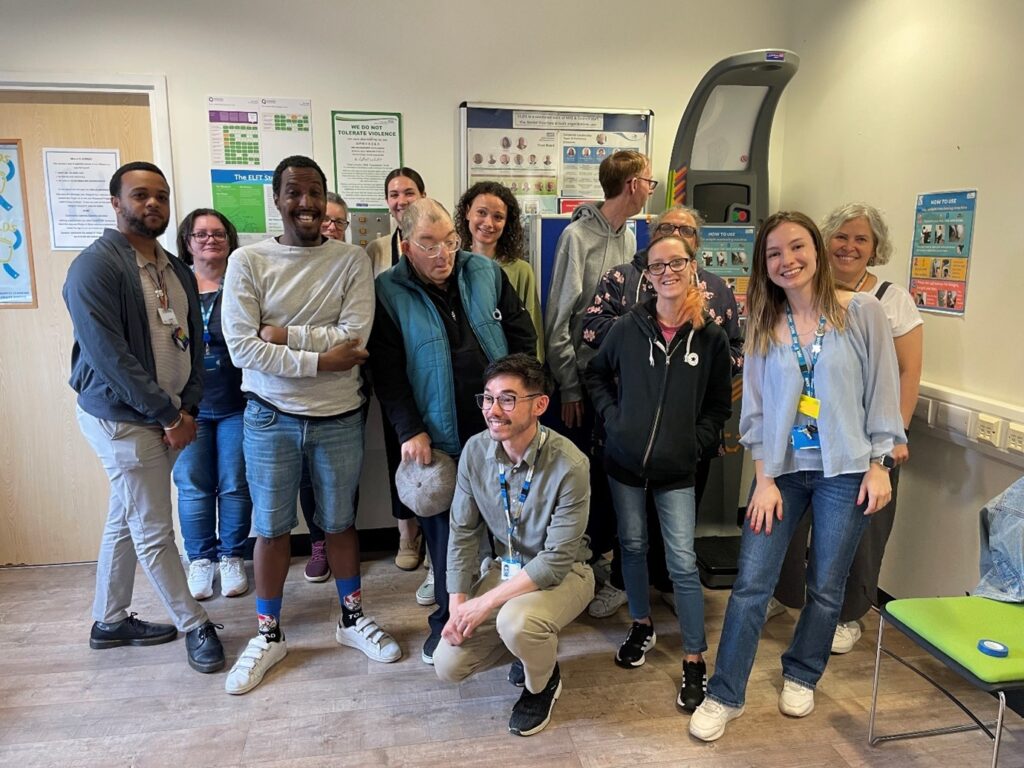
Figure 1: Community Learning Disabilities Service team health monitoring launch day
Individuals with learning disabilities (LD) face significant health disparities, particularly in weight management. In Tower Hamlets—a diverse, socioeconomically challenged area—this issue is compounded by high rates of obesity, metabolic disorders, and related complications. A review conducted by the Tower Hamlets Community Learning Disabilities Service (CLDS) in June 2023 revealed that body mass index (BMI) had been recorded for fewer than 30% of service users in the last year and less than 3% weight recordings during health appointments, indicating a gap in monitoring and addressing weight-related health risks.
This prompted the commencement a quality improvement project with the aim of increasing the recording of BMI during appointments from 3% to 20% by September 2024. A project team consisting of dietitians, nurses, psychiatrists, occupational therapists, psychologists, physiotherapists, social workers, and administrative staff, service users were formed to tackle this problem.
This project aligns with the Trust’s priorities for reducing health disparities, especially for individuals with serious mental illnesses and learning disabilities. Using the triple aim of quality (3Q):
- Improved health outcomes through targeted interventions.
- Enhanced care experiences by empowering service users with tools like well-being journals.
- Optimized resource utilization by addressing weight risks earlier, preventing complications.
Baseline Performance
- Less than 30% of service users had BMI recorded and less than 3% had their weight recorded at appointments.
- Staff confidence in addressing nutrition and weight risks was inconsistent.
- Service users and carers lacked awareness of the links between weight and health outcomes.
Service User Quote:
“I didn’t know my weight could affect my health in so many ways.”
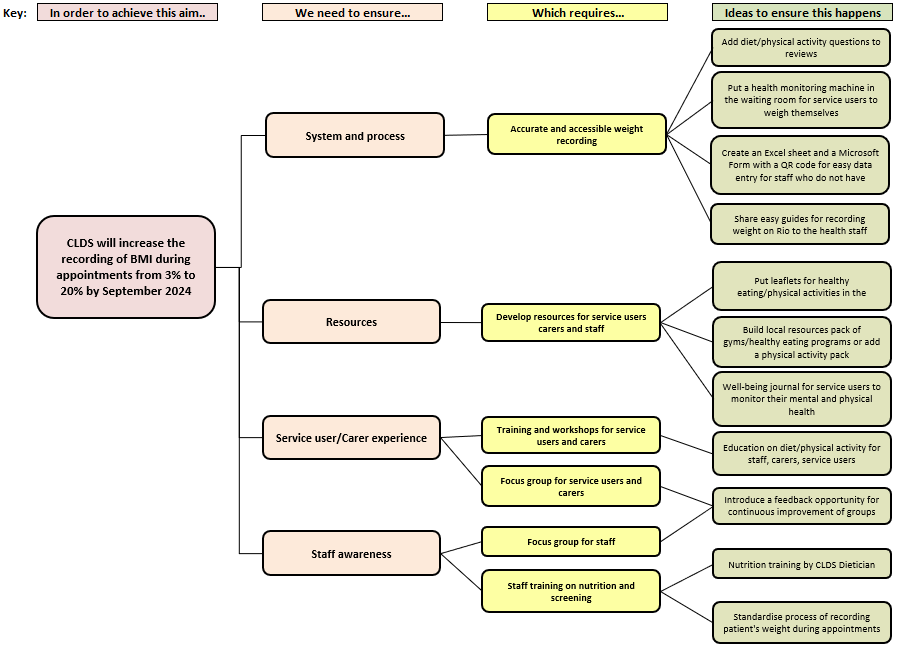
The team developed their theory of change using a tool called a driver diagram (See Figure 2) which helped them to identify the key components in their process they needed to change in order to help them achieve their overall aim of increasing the recording of BMI during appointments.
Figure 2: CLDS Driver Diagram
The team then went on to test interventions with the aim of improving BMI monitoring and raising awareness in staff and service users by using multiple Plan-Do-Study-Act (PDSA) cycles:
- Development and distribution of well-being journals tailored to service users’ needs: Well-being journals were co-designed with service users to support health tracking and empower them to monitor their well-being. Initially distributed to participants in the Shape Up weight management program, the journals received positive feedback. Plans are underway to expand distribution to a wider group.
- Installation of a health monitoring machine in the waiting area: A health monitoring machine was introduced to facilitate easy BMI tracking. With added staff support and user-friendly guides, engagement significantly increased. Both service users and carers provided positive feedback, with carers also using the machine to monitor their own weight.
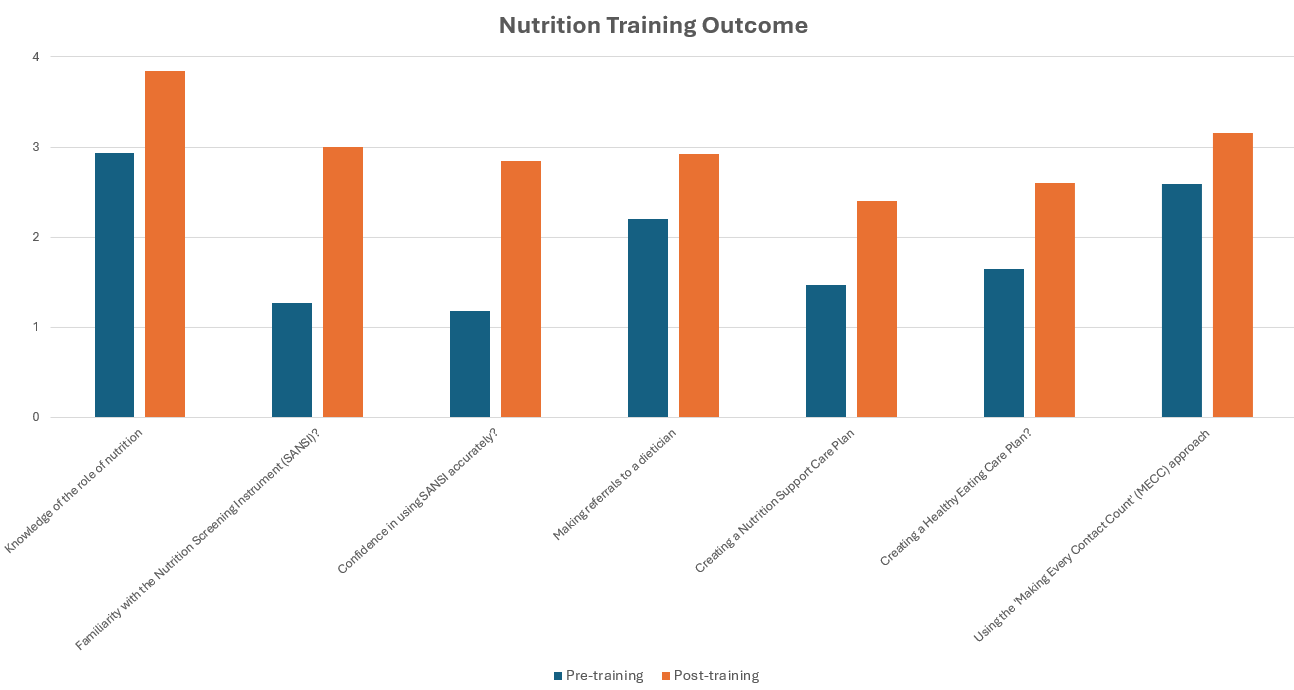
- Nutrition training for staff: Nutrition training was delivered alongside pre- and post-confidence assessments, with feedback forms collected. Overall, staff confidence improved, and the training received positive feedback. Plans are in place to embed this training as part of the induction process and offer a yearly refresher for all CLDS staff.
Evidence of Change
In order to determine whether the changes tested led to an improvement the team monitored the number and percentage of patients who had their weight recorded each month (See Figures 3 and 4).
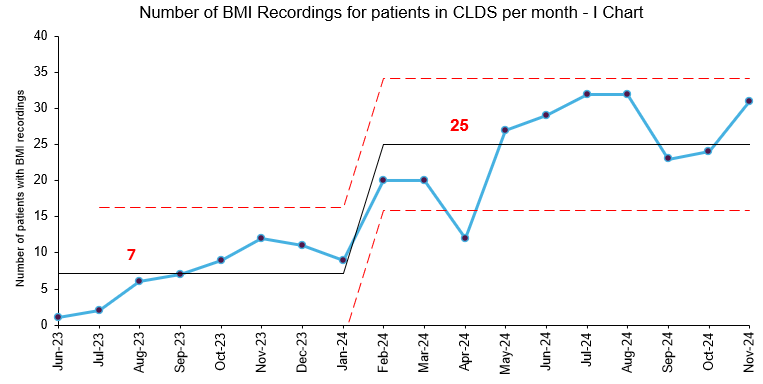
Figure 3: I Chart showing the number of patients who had their weight recorded during appointments each month
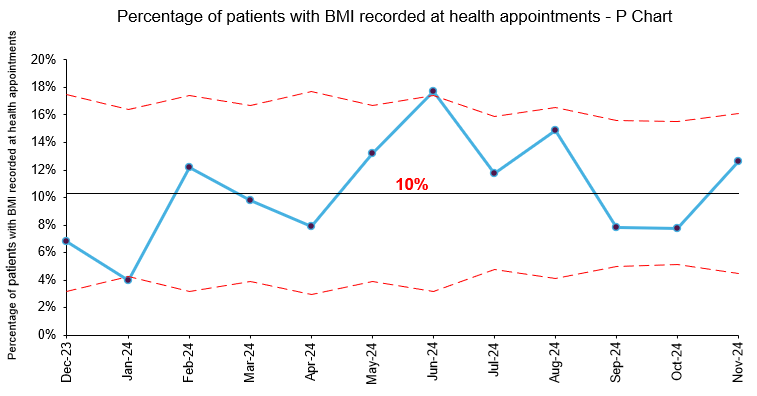
Figure 4: P Chart showing the percentage of patients with weight recorded at health appointments each month
- Average number of BMI recordings during appointments increased from 7 per month to 25 per month
- Positive feedback from service users, carers and staff indicated improved understanding of weight-related health risks.
- Staff reported greater confidence in addressing weight management issues during appointments (See Figure 5).
Figure 5: Nutrition training outcome
Key Challenges
- Limitations of the electronic recording system: Social workers in CLDS could only access Mosaic and not the electronic recording system Rio, making it difficult for them to contribute to weight tracking. To address this, the team created an Excel sheet and a Microsoft Form with a QR code for easy data entry. The collected data was monitored monthly, and weights were manually added to Rio to ensure accurate records. These solutions overcame Rio’s limitations and maintained consistent weight tracking despite access restrictions.
- Data quality issues The team’s aim was to improve the percentage of patients who had their BMI recorded during health appointments, however the health appointment data does not enable the team to identify which patients had multiple appointments each month. As BMI data was manually entered on a spreadsheet then transferred to Rio, only 1 BMI entry was entered for each patient per month making it difficult to calculate a true percentage of BMI recordings. The team were also unable to access data on the number of health appointments which took place between June and November 2023.
- Sustaining engagement with interventions like the health monitoring machine and the Rio weight recording form required continuous reinforcement due to several challenges. Staff engagement was initially difficult, requiring extra meetings, one-on-one support, and regular updates and reminders. Yearly nutrition training, refresher sessions, and embedding training into the induction process helped address these issues. Service users needed ongoing encouragement, supported by reminders and leaflets in waiting rooms to promote weight monitoring and provide first-line advice. Carer engagement involved distributing Excel sheets for day centre staff to monitor weights monthly and delivering “Shape Up” training for supported living staff to enhance their involvement. These efforts ensured consistent participation across all groups.
Learning and Next Steps:
This QI project has demonstrated that small, targeted changes can yield meaningful improvements in reducing health inequalities for individuals with learning disabilities. The team has recognised the value of multidisciplinary collaboration and culturally tailored interventions in addressing health inequalities. Standard practices now include routine BMI monitoring as part of health assessments and annual staff nutrition training.
The next phase of the project will build on this foundation to scale up impact and ensure long-term sustainability. This will include:
- Project scale up: Expand interventions to other regions within the Trust to standardize BMI monitoring practices.
- Ongoing Engagement: Continue engaging service users, carers, and staff through focus groups to refine and sustain interventions.
- Triple Aim Project: This project serves as a cornerstone for a broader triple aim project on weight management in Tower Hamlets.
Most Read Stories
-
Why is Quality Control important?
18th July 2018
-
An Illustrated Guide to Quality Improvement
20th May 2019

-
2016 QI Conference Poster Presentations
22nd March 2016
-
Recognising Racism: Using QI to Help Take Action
21st January 2021

-
Using data enabled us to understand our problem
31st March 2023

-
QI Essentials: What does a Chief Quality Officer do?
18th March 2019

Follow QI on social media
To keep up to date on the latest concerning QI at ELFT, follow us on our socials.

