Developing a strategy and change ideas
The Model for Improvement
Use the Model for Improvement
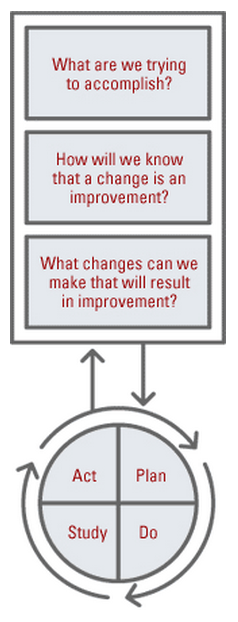
The ‘Model for Improvement’ is the framework we are using to drive continuous improvement.
It is essentially a method for structuring an improvement project. If you are looking to carry out a QI project, we will help guide you to develop your idea and test it out using this simple framework.
The model consists of two parts. The first three questions help us define what we want to achieve, what ideas we think might make a difference, and what we’ll measure to help us understand if change is an improvement.
The second part is the PDSA (Plan Do Study Act) cycle – outlining the steps for the actual testing of the change ideas. The cyclical nature allows the change to be refined and improved through repeated cycles of testing and learning. This provides a vehicle for continuous improvement.
Model for Improvement – Part 1 – The Framework
What are we trying to accomplish?
- Take the quality issue you’ve identified and turn it into an aim. Something that is SMART (Specific, Measurable, Achievable, Realistic, Timebound). We need to be able to say how good what it is we are improving is and by when. That way we’ll be able to show whether our quality improvement project is working.
Model for Improvement – Part 2 – The Engine
How will we know that a change is an improvement?
- We all measure things in our day to day jobs and in quality improvement this is no different. There are 3 types of measures we use in improvement projects:
Outcome – This is often directly linked to your aim e.g If your QI project was focusing on falls reduction then your outcome measure could be the number of falls occurring. There is often a tangible link between the outcome measure and the service user/end user.
Process -Your improvement project will likely involve changing or modifying different processes or systems to hopefully improve the quality issue you’ve identified. Its important to measure the reliability of these processes so you can track them back against your aim. For example going back to your falls project, you may want to focus on the process of risk assessment which will then help reduce the number of falls.
Balance – These can help show whether unintended consequences have been introduced elsewhere in the system
More about measures
Outcome Measures
How does the system impact the values of patients, their health and wellbeing? What are impacts on other stakeholders such as payers, employees, or the community?
- For diabetes: Average hemoglobin A1c level for population of patients with diabetes
- For access: Number of days to 3rd next available appointment
- For critical care: Intensive Care Unit (ICU) percent unadjusted mortality
- For medication systems: Adverse drug events per 1,000 doses
Process Measures
Are the parts/steps in the system performing as planned? Are we on track in our efforts to
improve the system?
- For diabetes: Percentage of patients whose hemoglobin A1c level was measured twice in the past year
- For access: Average daily clinician hours available for appointments
- For critical care: Percent of patients with intentional rounding completed on schedule.
Balancing Measures
(looking at a system from different directions/dimensions)
Are changes designed to improve one part of the system causing new problems in other parts of the system?
- For reducing time patients spend on a ventilator after surgery: Make sure reintubation rates are not increasing
- For reducing patients’ length of stay in the hospital: Make sure readmission rates are not increasing
For every project you will need between 5-8 measures.
What changes can we make that result in improvement? In order to improve quality we’ll need to make changes, though not every change will result in improvement. One way of trying to think about changes and also to understand the system in which you are working in is to use a driver diagram.

For more details about the model for improvement, visit the IHI website.
This is useful for sharing just this resource rather than the whole collection
Divergent convergent thinking
What is it?
Every team has ideas, initiatives and proposals to improve. Sometimes teams have a lot of them. Some may be useful and some not so much, some may be very simple and some may be much more elaborate. Using divergent convergent thinking we can find and use the best of these ideas to help the team to reach it’s best performance.
This sounds very simple. So imagine you lead a team and you have to tackle a certain problem or improve a given service. Being a smart and proactive leader you want to use, precisely, the best ideas available. But ask yourself these questions:
- How do you go about getting people to communicate their ideas?
- Assuming you gather a good number of proposals, how do you decide on which ones to choose?
- How do you get team members to agree on which initiatives to use?
Finally, after figuring out how to do that, think about how much time you would have to invest to get those answers.
Divergent and convergent thinking can be a structured, time efficient and inclusive way to get ideas from teams. With a proper use of this tool you can go from having individual, separated and secluded ideas to having a few ideas that the team has agreed to.
The rational in this tool is to use Divergent thinking to “produce” ideas and then use Convergent thinking to filter or funnel ideas. If we plotted the number of ideas over time we would end up with something very similar to a bell curve with two narrow ends and a more populated middle section. See the gif at the bottom of the page to see an example of this bell curve.
How do we use it?
The process starts by inviting the team to develop ideas around a specific goal or objective. After this, the fun starts. There is a total of 6 activities that complete the process. Here is an overview of each step. For further information click on each step.
- Brain storming
- This is a very popular technique used to generate ideas. Each team member has the chance to give an idea. The facilitator writes down each idea without discussing details.
- Nominal Group technique
- This is a kind of brain storming. The difference is that in this case the invitation is to engage in a quiet and individual process. Sticky notes are given to all team members and each idea is written down in one piece of paper. All ideas are posted on a flip chart.
- Affinity diagram
- The goal here is for the team to group ideas that are similar. This is an activity done by the whole team but quietly. After the grouping is done, each group is given a name or title.
- Multi voting
- This is a process recommended when the group comes up with more than 10 ideas. So each member of the group votes for the ideas they like most and the ideas with more votes are selected. This process can be done by making a matrix (As shown below) and giving sticky dots to team members. After this, each member sticks a dot in the idea or ideas of their preference.
- Rank ordering
- Each team member ranks the selected ideas in a given order (For example from 1 to 5) and finally the facilitator counts the votes for each idea.
- Rank ordering form
- Structured discussion
- In this final discussion, team members get an opportunity to express any thoughts they have regarding the selected ideas.
Watch how we generate and agree upon the best ideas using these techniques…
This is useful for sharing just this resource rather than the whole collection
Nominal Group Technique (NGT)
Brainstorming and Nominal Group Technique (NGT) are similar in that they both are designed to creatively and efficiently generate a list if ideas in a safe environment.
NGT follows the basic steps for brainstorming with the following exceptions:
Each member of the team is given a pile of sticky notes.
Each person is asked to write one idea on a sticky note.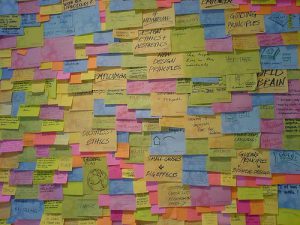
Usually about 5-10 minutes is sufficient to get their ideas down on the sticky notes.
The sticky notes are placed on a flipchart.
Review, clarification and elimination of duplicate ideas is done as in brainstorming.
Advantages
Giving all people space with their thoughts before hearing from colleagues
Avoids only hearing from the “loudest voices”
Avoids people feeling pressured to offer an idea or embarrassed if they don’t have one
This is useful for sharing just this resource rather than the whole collection
Multi-voting, Rank Ordering and Structured discussion
This is a bundle of Convergent thinking techniques. Used in this order, they can be very useful to help a team to choose from a large number of existing ideas. This bundle is usually the final part of the Divergent and Convergent thinking exercise following the Affinity Diagram.
Every team member has the opportunity to vote and rank every idea in a non-hierarchical manner. The structured discussion part should also encourage all participants to express their view on the chosen ideas. It’s a very important task for the facilitator to encourage participation and also keep an eye on the time.
At the end of the session, teams should not only have a small group of ideas that are approved by the majority but also a perspective on what it means to take those ideas to practice.
Multi- Voting:
This is usually recommended when a team has more than 10 ideas available to choose from. It is called multi voting because each team member will have more than one vote to assign to the ideas of their preference.
Before starting the voting round, all ideas must be charted in a visible place that is accessible to all team members. The facilitator gives out the same number of sticky dots to each participant. Each dot represents a vote. At this point the facilitator has to clarify if participants can either put only a single dot per idea or more than one.
In a silent manner team members post their dots in the ideas they prefer. Finally the facilitator counts the number of dots in each idea and selects the top 5 most voted ones.
Rank ordering
Rank Ordering
In this exercise, every member of the team gives a rank to each idea. At the end the rankings are added up and a final ranking comes up. An easy way to carry out this exercise is to build a matrix. Ideas are the heading of the rows and the team members names are the heading of the columns. After the matrix is set up, the participants rank each Idea.
There are also two ways to rank an idea, similar to the voting options on multi voting. One option is to rank all ideas with any number from a defined scale. The other option is to assign a different number in the ranking to each idea. Below is an example of the rank-ordering form.
![]()
Structured discussion
In this final activity each participant has a limited amount of time (for example 2 min) to say anything they think about the selected ideas. The facilitator, again, has the challenge to keep an eye on the time because often participants may extend beyond their time. The discussion also should be guided to think about the application or use of those ideas in real life context. Suggest examples such as like pros and cons, restraints, cost.
This is useful for sharing just this resource rather than the whole collection
Driver Diagrams
In a nutshell: A Driver Diagram serves as a tool for building a hypothesis that can be tested. It is developed by consensus and summarises what team members feel must change and which ideas may result in an improvement.
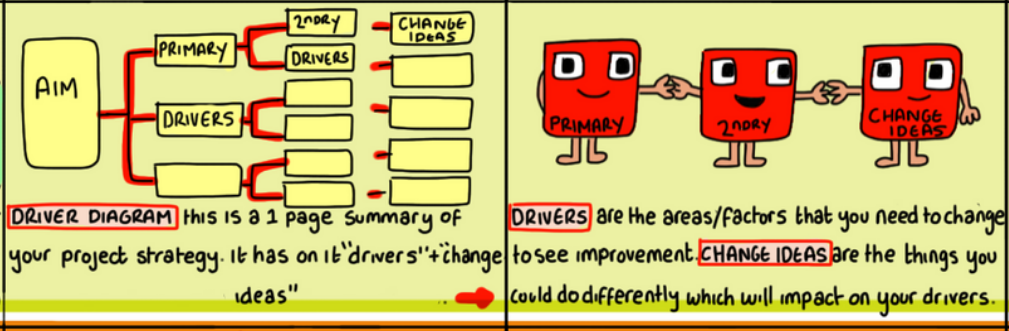
This is part of the ‘Developing a Strategy & Change Ideas’ illustration made by Sonia Sparkles for the Illustrated Guide to Quality Improvement, available here >>
A driver diagram illustrates a ‘theory of change’, that can be used to plan improvement project activities. This technique provides a way of systematically laying out aspects of an improvement project so they can be discussed and agreed on collaboratively by the project team. Teams at ELFT can use Life QI to create their driver diagrams online.
In essence, it is a visual strategy for tackling a complex problem.
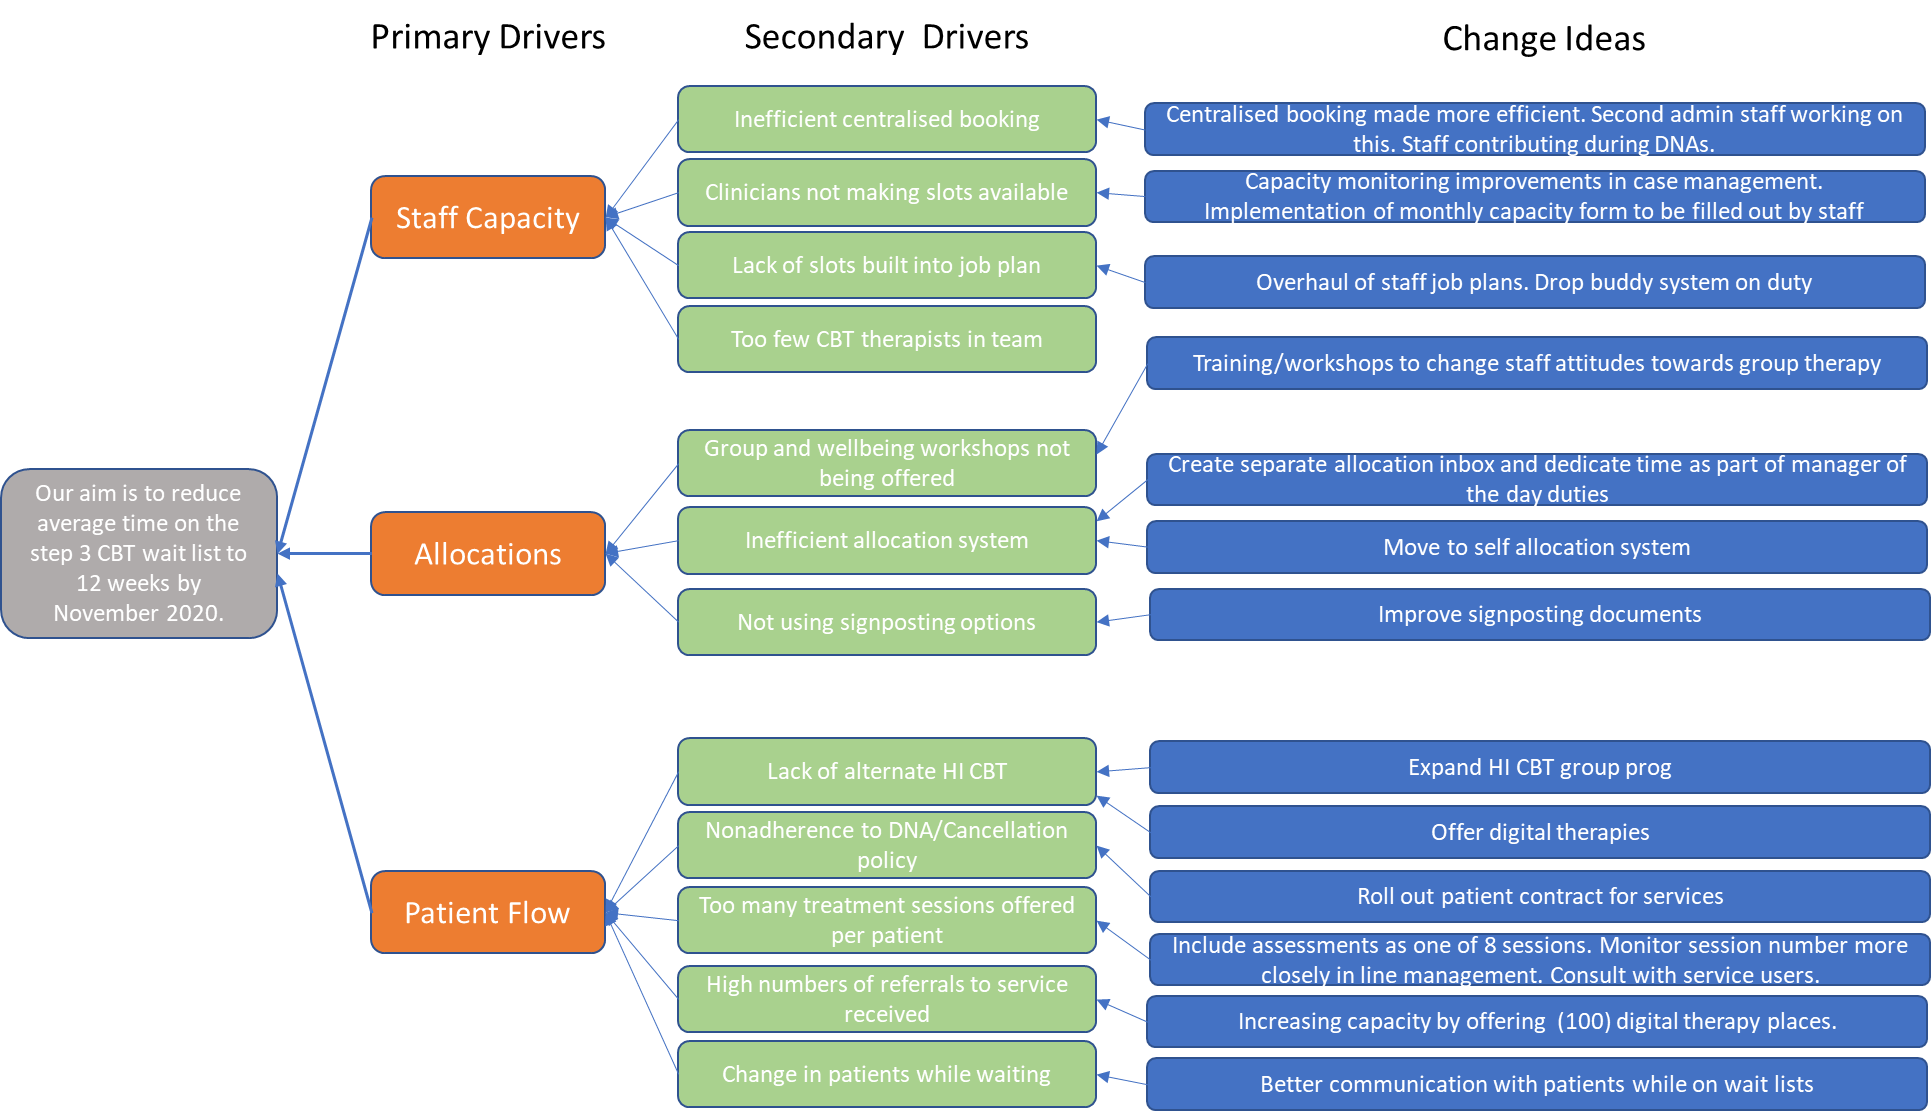
The below driver diagram was produced by an ELFT team to develop an improvement strategy to meet the team’s aim to reduce average wait time (from initial telephone assessment to first individual CBT treatment session) to 12 weeks by November 2020.
Driver Diagram Glossary
Aim
- This is what you want to achieve, and it must be measurable. It cannot simply be “to improve” or “to reduce”
- The aim should be meaningful to your patients / service users / families / customers. We recommend that you discuss with your patients what the aim for your improvement project should be
- Use available data to understand what your big quality issues are. This may help you define a suitable aim for an improvement project
- A well-written Aim helps you identify your Outcome Measure
Primary Drivers
- These are the big topics or areas that you will need to work on, in order to achieve your aim
- All key areas of the system that you will need to influence within your project, should be captured within your drivers
- Well-written Primary Drivers help you identify your Process Measures
Secondary Drivers
- Each Primary Driver could have Secondary Drivers. These are what would need to be in place to positively influence the Primary Driver
- You may need to involve other people who understand the primary drivers, to identify suitable secondary drivers
- The difference between primary and secondary drivers is one of importance. If the driver is big and critical, you should consider it as a possible primary driver
- Well-written Secondary Drivers help you identify relevant Change Ideas
Change Ideas
-
- These are the ideas that your team would like to test, in order to help move towards the aim.
- All change ideas should have an effect on at least one Secondary Driver. By association, all Change Ideas are expected to help achieve the Aim
- Taken together, these are the suite of changes that go into your project plan
- If you must prioritise change ideas, one method is to ask stakeholders: first “Which of these would have the biggest impact on the Aim?” then, “Which of these is the easiest to do?” (rank by impact & effort)
Your driver diagram is your improvement strategy. There is no right or wrong driver diagram – it should represent your team’s understanding of the system you are trying to improve. Your driver diagram will undoubtedly change through your project – as you get to understand your system and processes in more detail.
Additional resources
Other examples of project Driver Diagrams can be found in this Power point link
This is useful for sharing just this resource rather than the whole collection
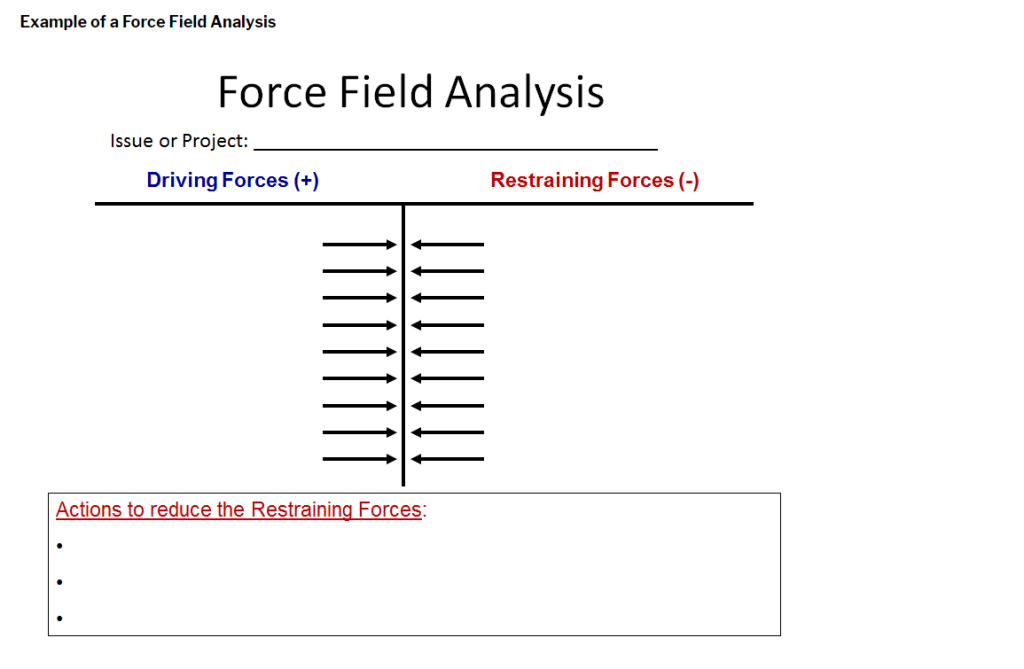
Force Field Analysis
What is it?
Force Field Analysis is a QI tool designed to identify driving (positive) and restraining (negative) forces that support or work against the solution of an issue or problem.
When the driving and restraining forces are identified, steps can be taken to reinforce the driving forces and reduce the restraining forces
What does the Force Field do?
- Allows comparisons of the “positives” and “negatives” of a situation
- Enables easy comparisons
- Forces people to think together about all the aspects of making the desired change a permanent one
- Encourages people to agree about the relative priority of factors on each side of an issue
- Supports the honest and open reflection on the underlying root
causes of a problem and ways to break down barriers
How do I set up a Force Field Analysis?
- Draw a letter “T” on a flipchart page
- Write the name of the issue or project across the top of the page
- Label the left column “Driving Forces” and the right column the “Restraining Forces”
- Use brainstorming or nominal group technique (NGT) to generate the list of forces or factors that are driving the issue or project and those that are restraining or the holding things back
- Eliminate duplicate ideas and clarify any ideas that are vague or not specific
- If the team feels the need, they can use rank ordering to set priorities for the driving and restraining forces
- Generate a list of ideas about actions that can be taken to reduce the restraining forces
This is useful for sharing just this resource rather than the whole collection
Creativity Methods
There are a number of tools you can use to generate ideas. The best tool to use will depend on the problems/issues you are faced with. Here are a few resources to help get you started
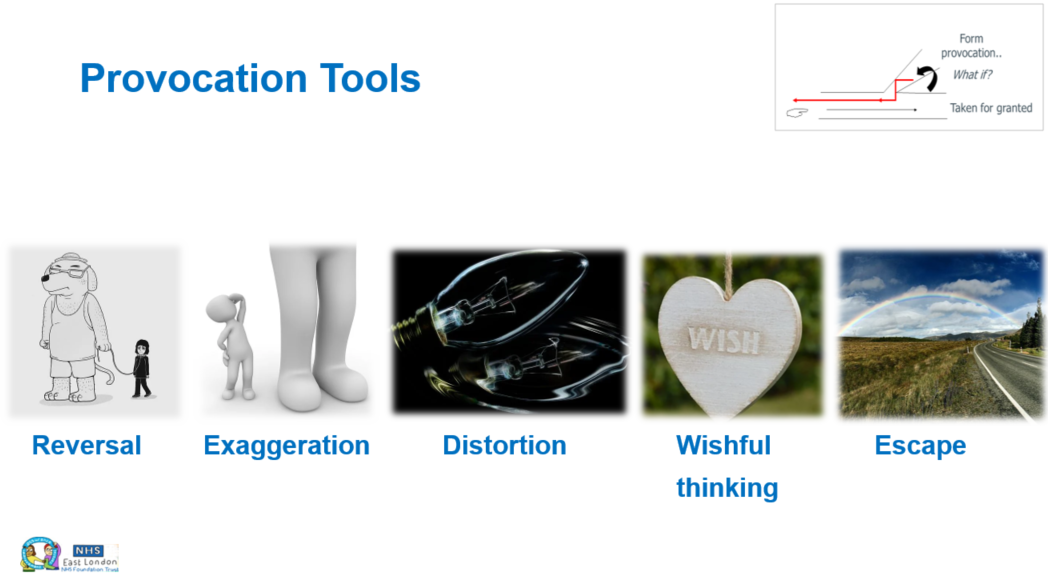
Provocation Tools
Click on the image below to access some learning from our Improvement Leaders’ Programme:
You can also try this exercise on using Random Words as Provocation here >>
Turn a Good Idea Into a Great One With the ‘Six Thinking Hats’
Here is a short video on how the Six Thinking Hats can transform your idea from something mediocre to something good.
IDEO Shopping Cart
Watch this short video from ABC Nightline about redesigning a shopping cart
This is useful for sharing just this resource rather than the whole collection
Quality Function Deployment
Quality Function Deployment (QFD) was developed to bring this personal interface to modern manufacturing and business. In today’s industrial society, where the growing distance between producers and users is a concern, QFD links the needs of the customer (end user) with design, development, engineering, manufacturing, and service functions.
Please click here to be directed to the QFD Institute for more information.
This is useful for sharing just this resource rather than the whole collection

Change Packages
“Change packages are summative knowledge artifacts that can be developed by systems, organizations or teams deliberately pursuing the improvement of outcomes relevant to them and their stakeholders.”
Read this Change Management Feature by Brandon Bennett from Qualityprogress.com, published in January 2020.
Click on the image to open
This is useful for sharing just this resource rather than the whole collection
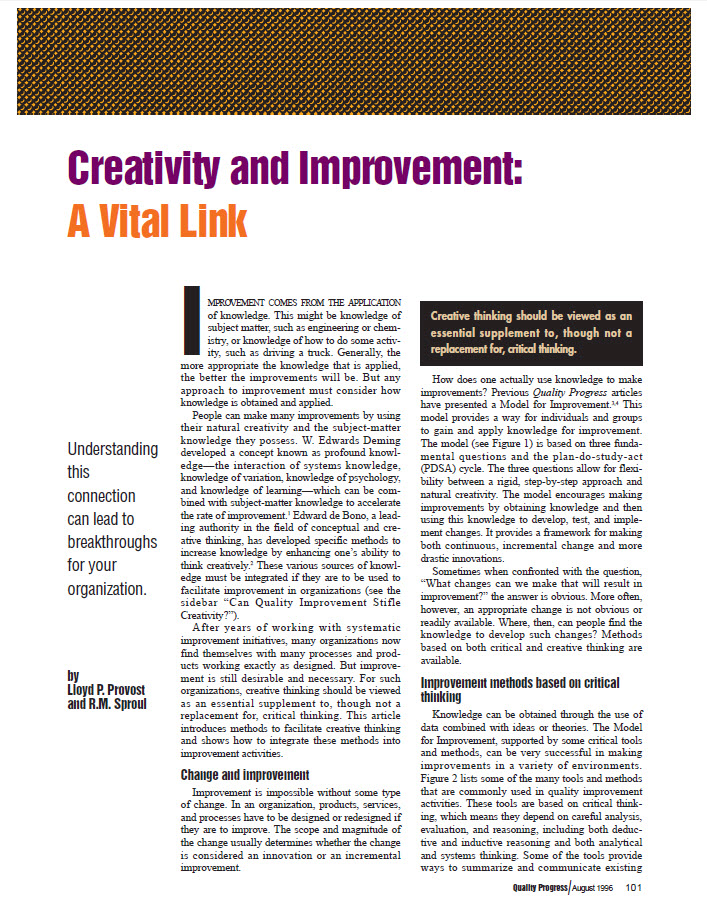
Creativity and Improvement
This fascinating extended article was written by Lloyd P. Provost and R.M. Sproul and reviewed by Edward de Bono and Thomas W. Nolan. It describes and talks about the improvement methods based on critical thinking, change & improvement, creative thinking tools for improvement, the logic behind de Bono’s methods, provoking new ideas, case study – quality improvement in metal cutting, how escape provocation helps develop a modification to the process, how control charts identify key source of variation, how flow diagrams standardise the process, integration & application and how to tap into the value of creative thinking.
Please click on the PDF image to the left to read more…
This is useful for sharing just this resource rather than the whole collection
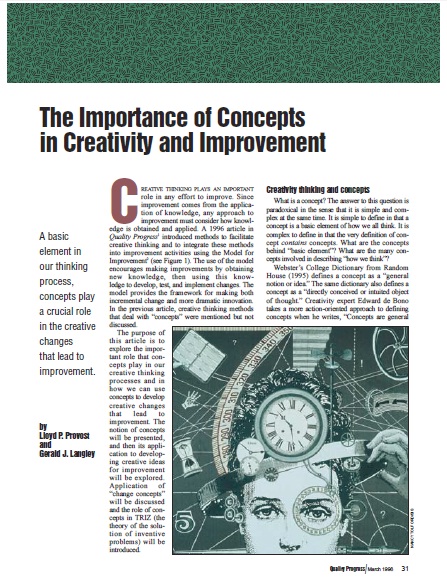
The Importance of Concepts in Creativity and Improvement
This genuine and dense article written by Lloyd P. Provost and Gerald J. Langley talks about a basic element in our thinking process, concepts and how they play a crucial role in the creative changes that lead to improvement.
Please click on the image to the left to read more…
This is useful for sharing just this resource rather than the whole collection
