
The Crisis Line: Reducing Unanswered Calls
20th January 2022
By Lara Odelusi, Improvement Advisor & Melanie King, Tower Hamlets Crisis pathway service manager
In this five-minute read, you can find out about how the Tower Hamlets Crisis Line have used quality improvement to reduce the number of unanswered calls to the service. Find out what they did, which change ideas resulted in an improvement and what is next for the project.
The 24 hour, seven days a week crisis telephone line service was set up to provide support to people in Tower Hamlets experiencing a mental health crisis.
However, in January/February 2021 the team noticed from their data that there were more calls which were not answered or abandoned. People in need of support were not able to get through to the crisis line and were left waiting for extended periods of time in the call queue or abandoning the call. The crisis line team in Tower Hamlets recognised this as a quality issue so to further understand the problem, data was collected over time to identify the number of calls answered.
The team wanted to understand the reasons why some calls were not being answered and what needed to happen so more calls could be answered. These calls are termed ‘abandoned calls’ and represent those unanswered or dropped due to long waits. The calls were broken down into times of the day, and it was identified that daytime calls were answered less frequently (due to the volume of calls during the day) than nighttime calls. Part of the problem was staffing capacity to manage the volume of calls received both during the day and nighttime.
The team’s aim was ‘to reduce the percentage of abandoned calls at the Tower Hamlets Crisis Line from 25% to 15% by May 2022’. They also developed a driver diagram (Figure one below) to help them articulate their theory of change and then develop some change ideas that they wanted to test.

Figure one: the team’s driver diagram
The team’s main outcome measure was the percentage of unanswered calls. They displayed this weekly on a control chart to help them visualise progress over time as shown in Figure two below.

Figure one: Percentage of weekly unanswered calls (P Chart)
The team realised that they needed to make both adaptive and technical changes as part of their project. Adaptive changes are those where there are new challenges that require learning to solve them, and technical changes are those problems for which we already know the solution for (see Figure three below).

Adaptive changes benefit from the use of Plan Do Study Act cycles (PDSA) to help test an idea rapidly and on a small scale to help you learn what works and doesn’t.
The team began by deciding to test the recruitment of bank staff to increase capacity to answer calls during the covid19 pandemic using PDSA cycles. In March 2021, bank staff were recruited to provide additional support to the crisis line. They predicted that this would reduce the number of unanswered calls. The team ran this PDSA for four weeks and after studying their data found that there had not been a reduction in the number of unanswered calls as had been predicted. Exploring this further, the team found that using bank staffing presented additional issues including:
- Shift not being covered due to bank staff unavailability
- A high turnover of bank staff
- Difficulty with maintaining consistency with training bank staff
As a result of their learning, the team decided not to continue with the bank staff change idea. However, additional staffing resource was still an option the team wanted to consider. Using the data on answered calls they had collected; the team made a business case to management to employ additional permanent staff.
They predicted that permanent staff would help them avoid the issues described above with the use of bank staff. In April 2020, one member of permanent staff was employed to help increase capacity and reduce unanswered calls in the team. The control chart in figure 2 demonstrates this reduced unanswered calls from 28.1% to 22.8%. Based on the success of this, a further member of staff was recruited in June resulting in a further reduction in unanswered calls to 13.2%.
The team also introduced several other interventions that they believed would reduce the number unanswered calls. These were ideas that were not tested using PDSA because they were understood to be more technical changes. These included a series of online virtual training sessions to educate CMHT and liaison staff on the crisis line service and what was on offer. Secondly the team introduced regular monthly meeting between the crisis line and liaison team based in the local Accident and Emergency Department. Although the data does not suggest this has directly reduced unanswered calls, reports suggest that communication has improved between the two teams.
The chart demonstrates that there has been an improvement in the average percent of abandoned calls from 28% at baseline to 13% as of current.
To complement the data on control charts, feedback from service users has also been positive as shown below:
Service user A: ‘Thank you for being there and being helpful’
Service user B: ‘I don’t know what I would have done if you weren’t there’
Service user C: ‘This is the best crisis line I have ever called’
By using some simple improvement tools such as driver diagrams, control charts and PDSA the team were able to make changes leading to an improvement. The involvement of a service user with lived experience played an integral part throughout the project.
Most Read Stories
-
Why is Quality Control important?
18th July 2018
-
An Illustrated Guide to Quality Improvement
20th May 2019

-
2016 QI Conference Poster Presentations
22nd March 2016
-
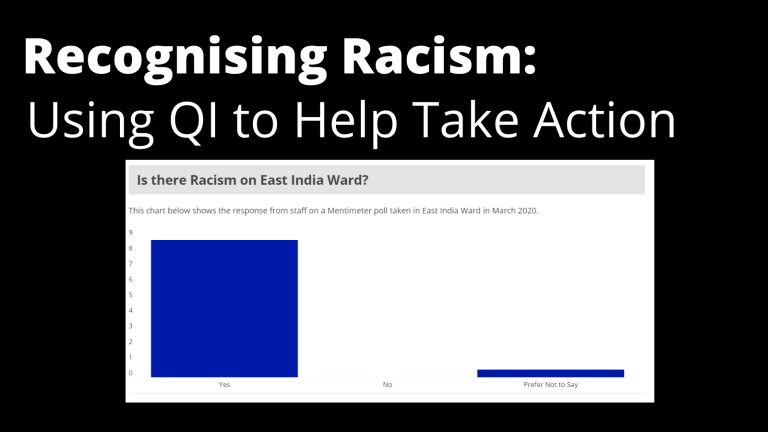
Recognising Racism: Using QI to Help Take Action
21st January 2021
-
Using data enabled us to understand our problem
31st March 2023
-
QI Essentials: What does a Chief Quality Officer do?
18th March 2019


Follow QI on social media
To keep up to date on the latest concerning QI at ELFT, follow us on our socials.