
Using Data for Decision Making in the Quality Improvement Department
12th July 2021
By Akkash Purani, Senior Improvement Data Analyst and QI Coach
Is it true that we only have one job in our current roles? It’s often been said that we really have two jobs: one, to do the actual job we’ve been hired for and two, to improve how that job is done.
This is the foundation of Quality Improvement (QI).
The QI Department is always looking to improve and streamline processes and to remove the clunky and manual ways which are no longer tenable. As the team started using technology more due to the pandemic, it was the perfect opportunity for them to begin looking at other ways that technology could be used to streamline their processes.
One area where the QI Department has been trying to do this is with the monitoring of the department’s data. A previous story on how the department is monitoring its performance against their objectives highlights the other work being done in this area. The focus of this story is on how the department uses their data to help with decision making.
The QI Department hosts many events each year. There are training offerings such as the frequently run Pocket QI, which is currently being offered virtually, as well as other events such as open mornings. Registration data for these events was stored inconsistently. Multiple Microsoft (MS) forms have been used in the process which has proven to be both inefficient and ineffective.
In the past, there have been manual checks regarding the number of registrations for events which is time-consuming. In addition, there was limited oversight of sign-ups which caused last minute logistical issues.
To resolve this, a request was made that all the registration data be accessible in one single place. The ‘QI events dashboard’, using MS PowerBI, was designed, and developed (figure 1). This enables the department to visualise a snapshot of the number of sign-ups, removing the manual process of checking the number of registrations for upcoming training and events.

Figure 1: the first draft of the events dashboard
The original plan was for the events dashboard to be separate from the objectives dashboard. However, the department concluded that they would not be making the best use of their current resources by creating additional dashboards. They had the opportunity to further streamline their processes by supplementing their objective dashboard with the data that was due to be in the events dashboard (figure 2).

Figure 2: data from the events dashboard integrated into the objectives dashboard
Tracking registrations enables answers to the following questions:
- Are the communications adequate for upcoming events and trainings?
- Is the department almost at full capacity for the number of bookings they can take?
- Does the department need to cancel an event due to a lack of sign-ups?
“The goal is to turn data into information, and information into insight”
– Carly Fiorina, Former HEO of Hewlett Packard
The next step was to incorporate an automatic refresh of the Events Dashboard, with help from the Trust’s Informatics department, this has now been included in the objective’s dashboard, with refreshed every 30 minutes. This has reduced the resources and especially time previously needed to manually update the dashboard.
“The ultimate purpose of collecting data is to provide a basis for action or a recommendation”
– W.E Deming, American Engineer
Data on its own is not enough and there needs to be some form of action taken after data evaluation.
Are you using your data for recommendations and actions?
What processes can you change?
Most Read Stories
-
Why is Quality Control important?
18th July 2018
-
2016 QI Conference Poster Presentations
22nd March 2016
-
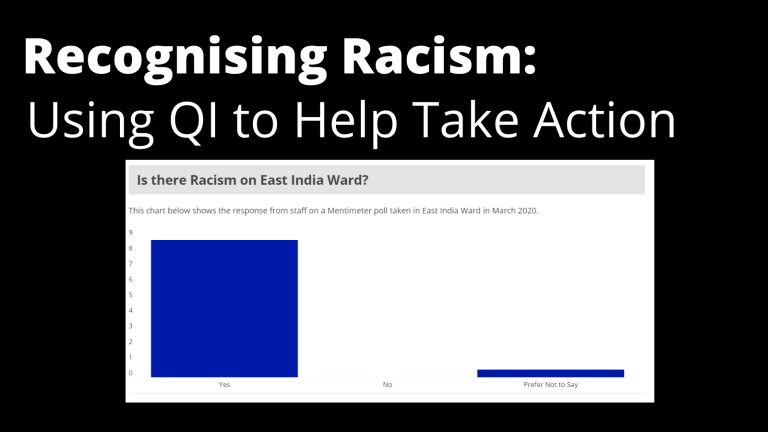
Recognising Racism: Using QI to Help Take Action
21st January 2021
-
QI Essentials: What does a Chief Quality Officer do?
18th March 2019

-
Using data enabled us to understand our problem
31st March 2023
-
Follow QI on social media
To keep up to date on the latest concerning QI at ELFT, follow us on our socials.